Figure 1.
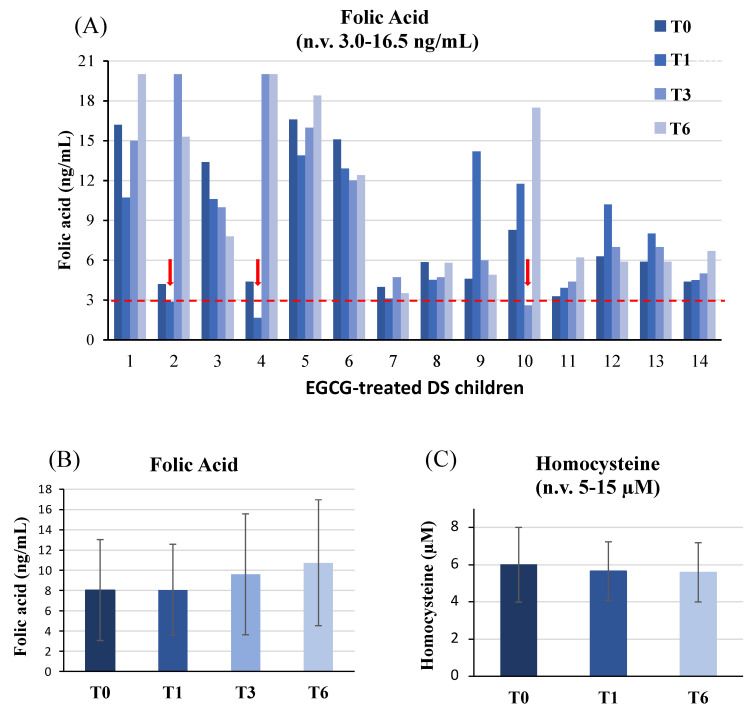
Plasma folate and homocysteine levels. Folate levels analyzed in EGCG-treated DS children (A) and the mean values of plasma folic acid (B) and homocysteine (C) levels are depicted. In panels 1B and 1C, mean values at individual time-points are not significantly different (p > 0.05) compared to baseline (T0).

