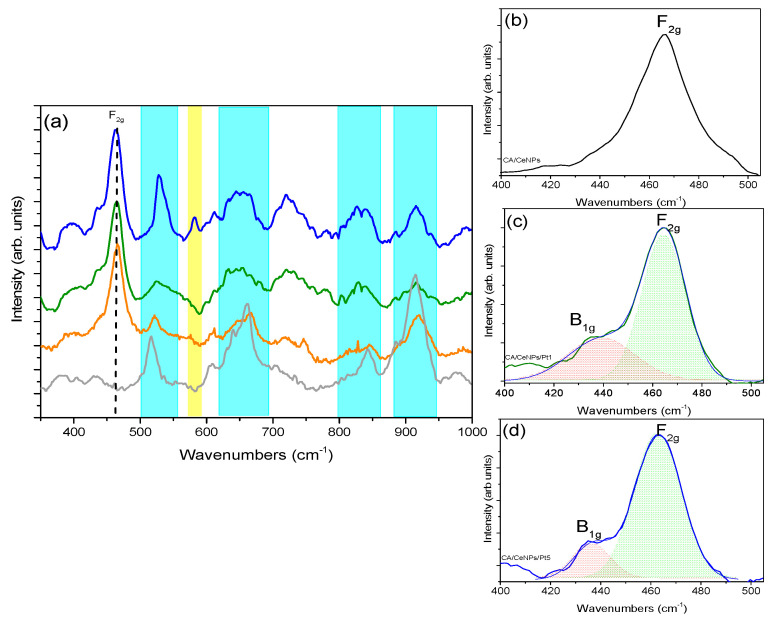
Figure 6.
(a) Raman spectra of all fibrous mats, CA/CeNPs (orange line), CA/CeNPs/Pt1 (green line), CA/CeNPs/Pt5 (blue line), and CA (therm. treated) matrix (grey line). The blue shadowed peaks correspond to the CA signals and the yellow to the vibrational mode of CeNPs at 580 cm−1. (b) Deconvoluted Raman spectra of CA/CeNPs (c), CA/CeNPs/Pt1, and (d) CA/CeNPs/Pt5 in the region 400–500 cm−1 show the F2g peak characteristic of CeO2 and the B2g signal referred to PtNCs.

