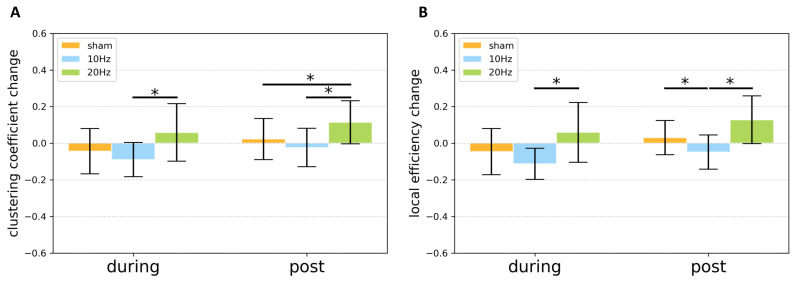
Figure 6.
The bar chart of (A) clustering coefficient change and (B) local efficiency change of the network in motor-related regions for various conditions during and after stimulation. Error bar stands for the standard error. Asterisk (*) indicates that a significant difference was observed at 0.05.

