
Figure 3.
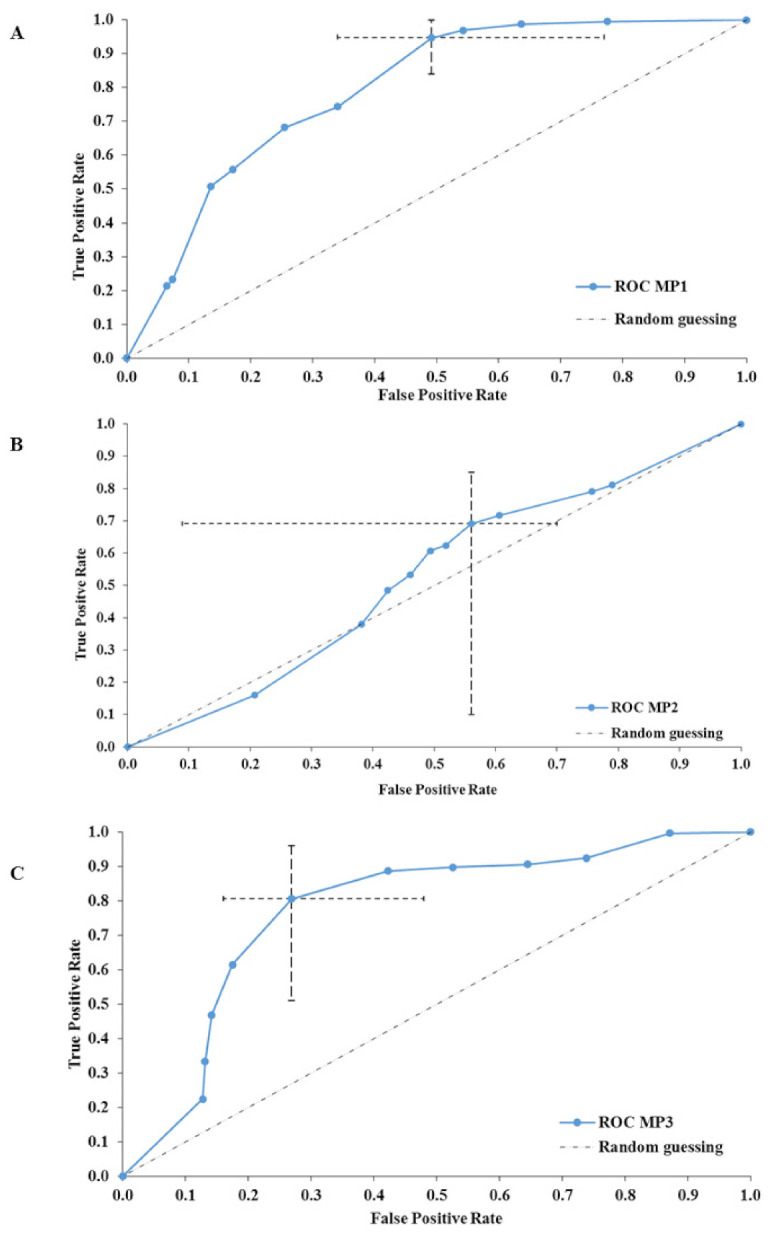
An overview of the model performance in three different groups between fecal metabolomes in delineation with three different groups of MP (MP1 < 30 (A), 30 < MP2 < 75 (B) and MP3 > 75 (C)). Please note the rather uncharacteristic and hard to classify makeup of metabolomes observed in the intermediate, healthy, group (B). Horizontal and vertical dashed lines represent 95% confidence interval for false positive and true positive rates, respectively. The black dashed line represents model performance in case of random guessing; blue line represents training mean performance of the model.