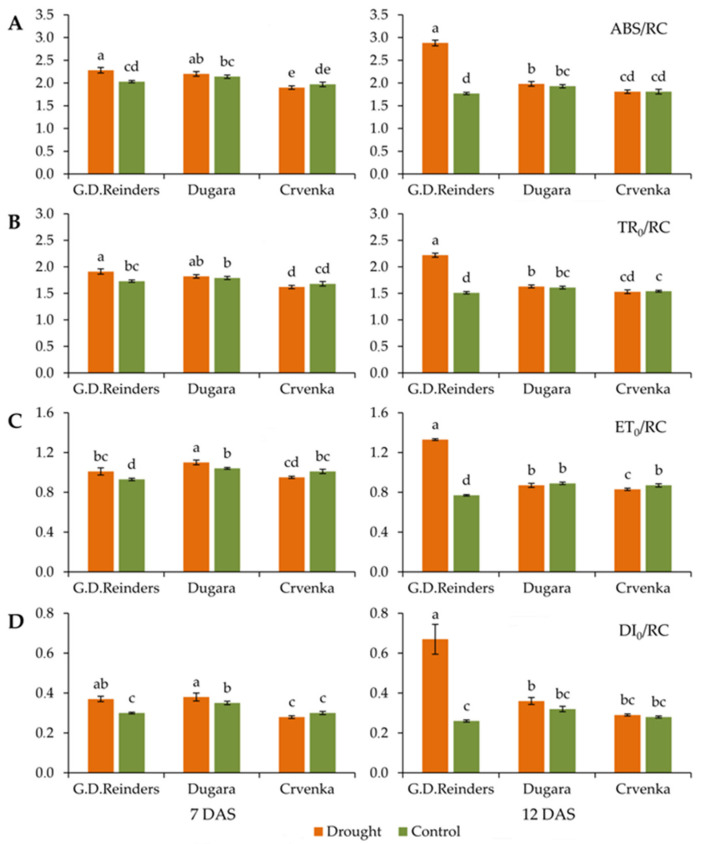
Figure 1.
Absorption per active reaction center (ABS/RC) (A), trapped energy flux per active reaction center (TR0/RC) (B), electron transport flux per active reaction center (ET0/RC) (C), dissipation energy per active reaction center (DI0/RC) (D), measured in control and drought-stressed apple cultivars (“Golden Delicious Reinders”, “Crvenka” and “Dugara”) at 7 and 12 DAS (day after stress). Values are presented as relative units. Values are mean ± SE (n = 15). Different letters indicate significant difference among treatments and cultivars at p < 0.05 according to the LSD test.

