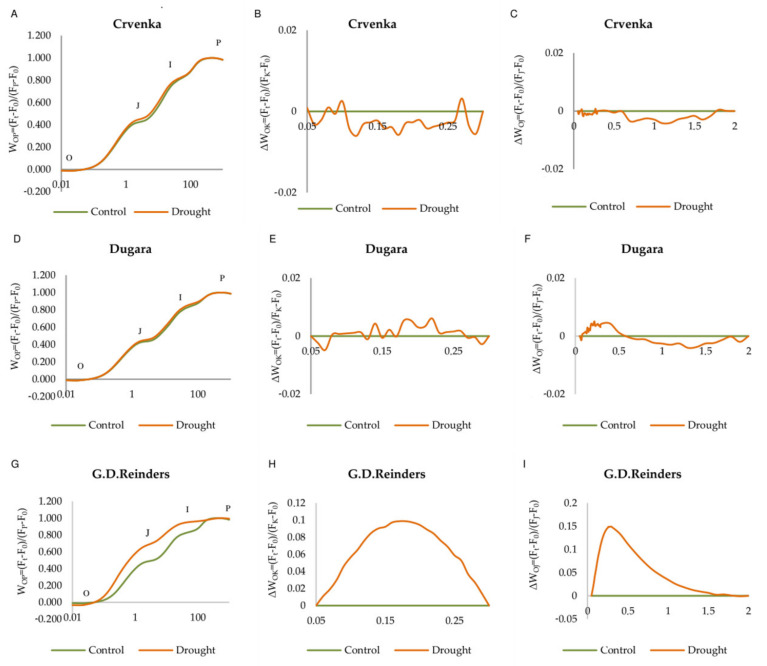
Figure 3.
Chlorophyll a fluorescence OJIP transient curves of leaves of three apple cultivars submitted for 12 days to drought stress. Transients curves were normalized between O and P steps: WOP = (Ft − F0)/(FP − F0) (A,D,G). The difference kinetics ΔWOJ (C,F,I) reveal the K-band; ΔWOK (B,E,H) reveals the L-band. ΔWOJ [ΔWOJ = VOJ(treatment) − VOJ(control)] and ΔWOK [ΔWOK = VOK(treatment) − VOK(control)] were calculated from the comparisons of the stressed and control plants. Mean values (n = 15).

