
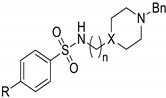
Table 2.
Biological activity of the compounds towards the inhibition of AChE and Aβ1–42 aggregation.
|
X | R | n | AChE Inhib.a IC50 (μM) ± SD |
Aβ1–42 Aggreg. Inhib.b,c (%) |
|---|---|---|---|---|---|
| 5 | N | Me | 2 | ≥100 | 41.8 |
| 6 | N | OMe | 2 | 89 ± 9 | 37.2 |
| 7 | N | Ph | 2 | 38.7 ± 0.2 | 34.6 |
| 8 | CH | OMe | 1 | 6.2 ± 0.9 | 64.2 |
| 9 | CH | Ph | 1 | 1.6 ± 0.2 | 60.7 |
| Tacrine | − | − | − | 0.15 ± 0.02 | 54.5 |
| DNP d | − | − | − | 0.026 | <5 |
a The values are mean of two independent experiments ± SD; AChE from Electric eel; Tacrine was used as a control; b Inhibition of self-induced Aβ1–42 aggregation (%) by the thioflavin-T fluorescence method in the presence of the inhibitor (40 μM); Tacrine was used as a control; c The values are the mean of three independent measurements in duplicate (SEM < 10%); d references [3,27].