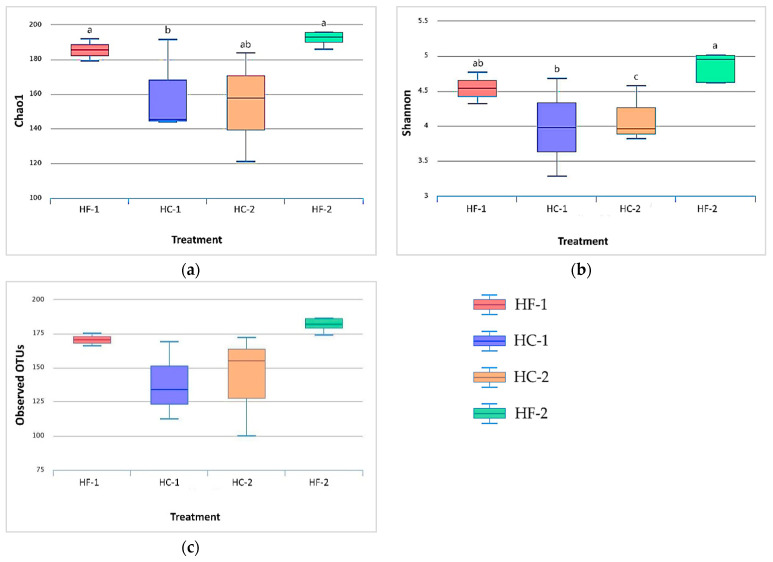
Figure 4.
Boxplot representation of alpha diversity indices: (a) chao1, (b) Shannon, and (c) observed OTUs, between diet groups. Alpha-diversity metrics’ visualization were done in MetaCOMET [40] and computed using QIIME [39]. HF-1, high-forage diet; HC-1, high-concentrate diet; HC-2, high-concentrate diet; HF-2, high-forage diet. a–c superscript denotes significant differences (p < 0.05).

