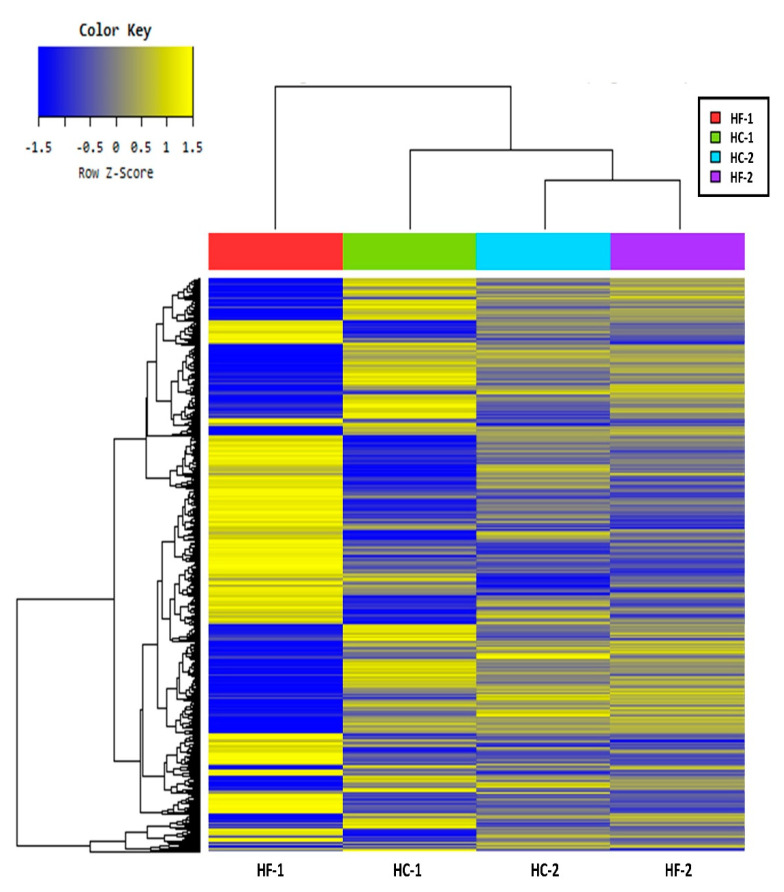
Figure 7.
Hierarchical clustering analysis by Euclidean distance and complete linkage showing the similarity of genes and treatments based on normalized value of expression level from the significant list. HF-1, high-forage diet; HC-1, high-concentrate diet; HC-2, high-concentrate diet; HF-2, high-forage diet.

