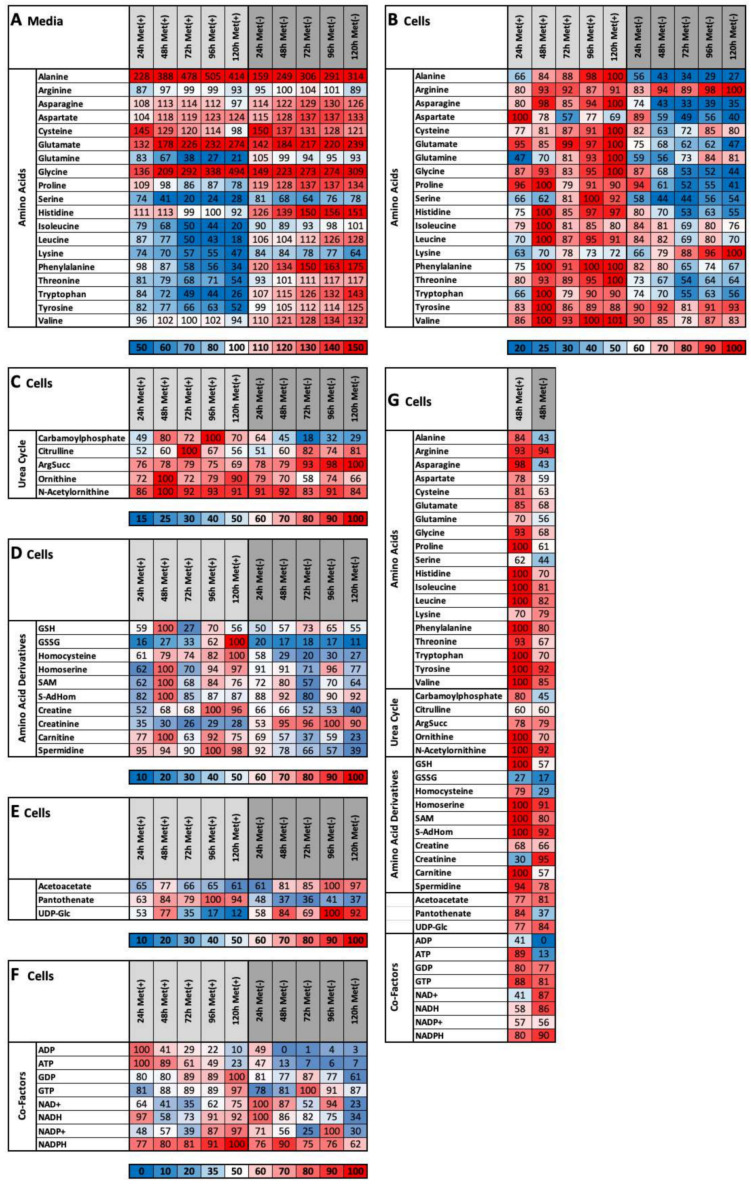
Figure 5.
(A–G) Heat map overview of selected metabolites. The percentages of intracellular (A), extracellular (B) and nonproteinogenic (urea cycle) (C) amino acids, directly-cysteine-dependent (D) and indirectly-cysteine-dependent (E) amino acids and energy currencies (F) were determined as described in the Materials and Methods. (G) The results after 48 h that define the candidates for metabolic fingerprint are shown.

