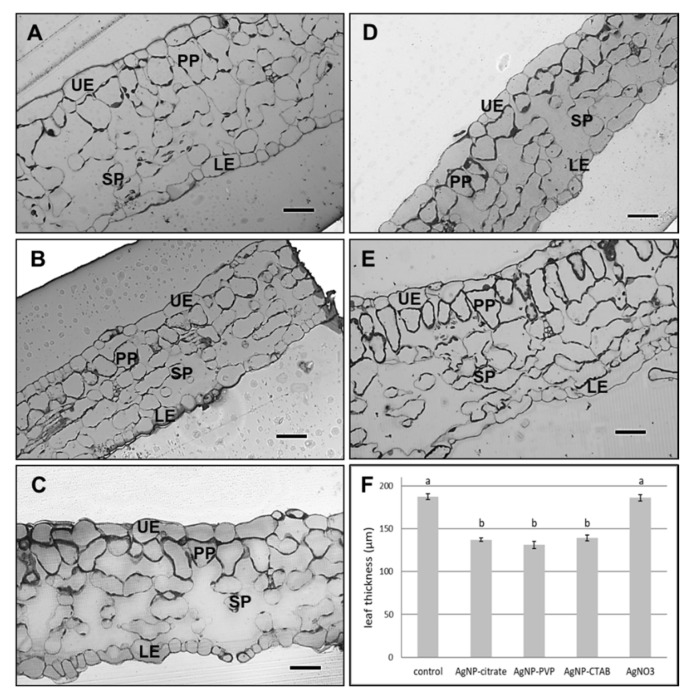
Figure 5.
Semithin sections of leaf from (A) control plant, and plants exposed to (B) 100 µM AgNP-citrate, (C) AgNP-PVP, (D) AgNP-CTAB and (E) AgNO3 in liquid ½ strength MS medium as well as (F) comparison of leaf semi-thin sections thickness. Bar = 41.8 µm. UE—upper epidermis, LE—lower epidermis, PP—palisade parenchyma, SP—spongy parenchyma. Values are the means ± SE of ten measurements. Columns marked with different letters indicate that treatments are significantly different at the p ≤ 0.05 level.

