Figure 2.
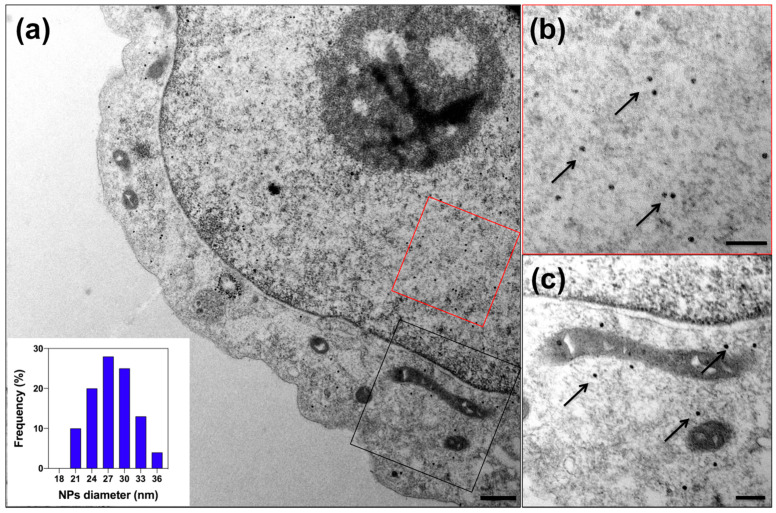
TEM images of the HepG2 cells transiently expressing QtEncFLAG with QtIMEF cargo protein (QtIMEFP2AQtEncFLAG) and iron transporter Zip 14 cultivated in the medium supplemented with 2 mM ferrous ammonium sulfate (FAS) for 24 h. (a) Overview TEM image; the scale bar represents 500 nm. Close-up of exemplary regions in the nucleus ((b), red rectangle) and cytosol ((c), black rectangle)) with arrows pointing to the individual nanoparticles (NPs) containing iron; the scale bar represents 200 nm. The inset in (a) illustrates the size distribution of iron oxide cores inside the encapsulin shells.

