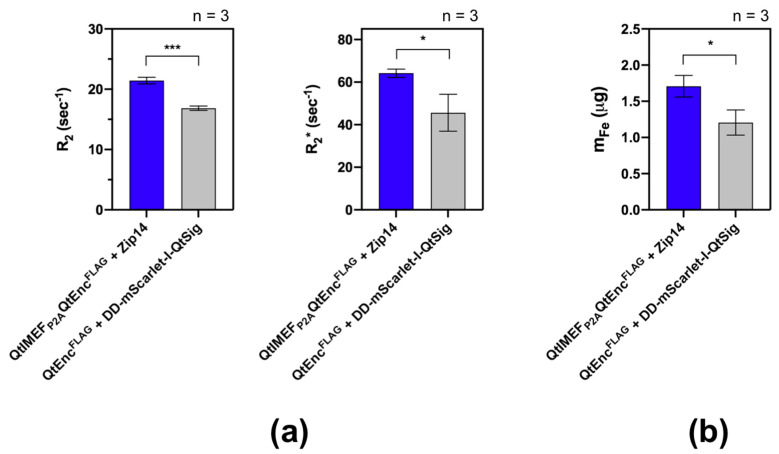
Figure 3.
MRI relaxometry of the HepG2 cells transiently expressing the constructs as indicated in the figure and cultivated in the medium supplemented with 2 mM FAS for 24 h. (a) R2 and R2* values were computed from cell pellets comprising ~8 × 10⁶ cells. (b) Fe masses in the same cell pellets determined by inductively coupled plasma mass spectrometry (ICP-MS). All numbers are plotted as mean values ± SD (n = 3). Statistical analysis was performed by unpaired t-test (*** corresponds to p-value < 0.001, * corresponds to p-value < 0.05).

