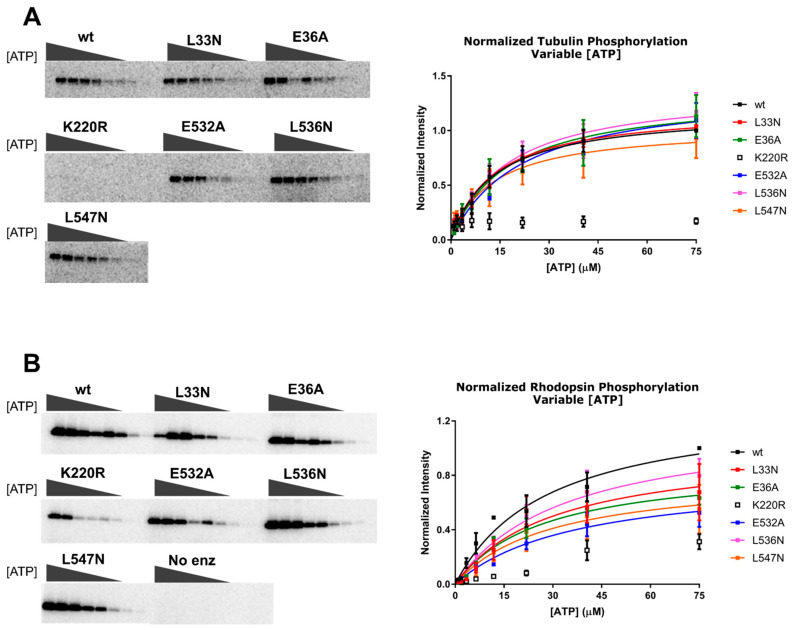
Figure 4.
Michaelis–Menten analysis of the GRK2 variants varying ATP concentration ([ATP]). Bovine GRK2 variants with a C-terminal H6 tag purified from HEK293F cells were analyzed by Michaelis–Menten kinetics. (A) Tubulin and (B) rod outer segments (ROS) phosphorylation by the GRK2 mutants, as detected by SDS-PAGE (left, corresponding to the results from a single representative experiment). Bands correspond to the phosphorylated product at variable [ATP] (0–75 µM). Band intensities were fitted to the Michaelis–Menten model using GraphPad Prism (right). Plots contain data from three experiments, and error bars represent the standard deviation (SD).

