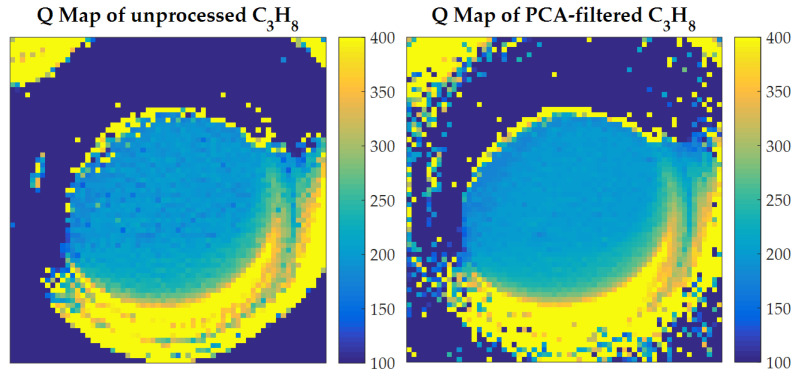
Figure 6.
Maps of Q values retrieved by iterative fitting from , unprocessed (left) and PCA-filtered (right). The scale is in ppm·m; the size of the field of view is 5.5 cm × 5.5 cm. Retrieved values of Q only have physical meaning in the central round region that corresponds to the gas cell window; it is clear that PCA filtering improves uniformity in that region.

