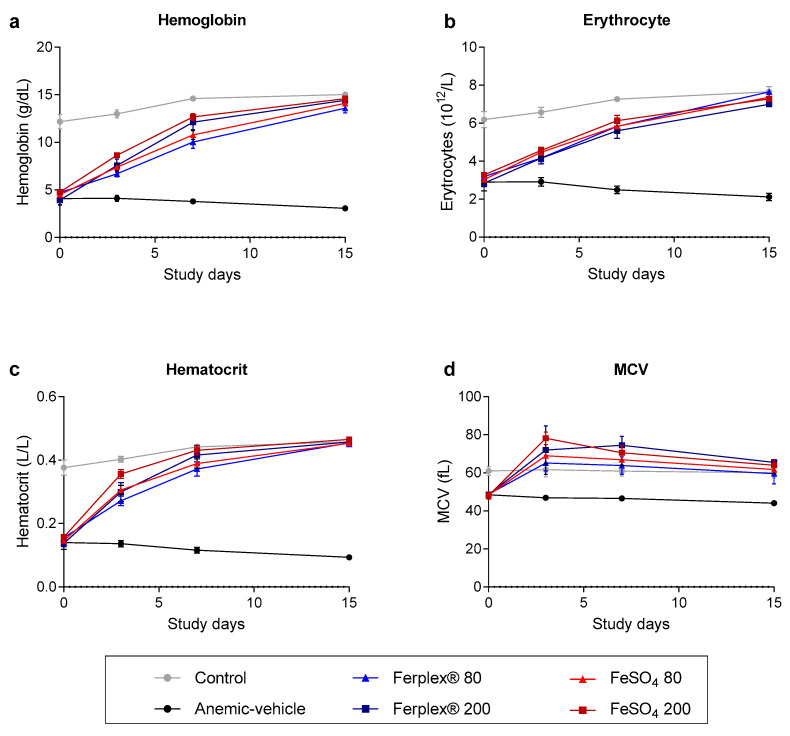
Figure 3.
Complete blood count monitored during the treatment period. (a) Hemoglobin, (b) erythrocyte count (c) hematocrit and (d) mean corpuscular volume (MCV) measured in blood samples on days 0, 3, and 7 and at study termination on day 15. Data are presented as mean ± SEM. No significant difference was observed between treatment groups (Ferplex® versus FeSO4) and doses. Neither was any significant difference detected between treatment groups at any time point. At termination there was no significant difference between treatment groups and control. Data were analyzed by means of a Kruskal-Wallis test followed by Dunnett’s multiple comparison test. N = 5–8.

