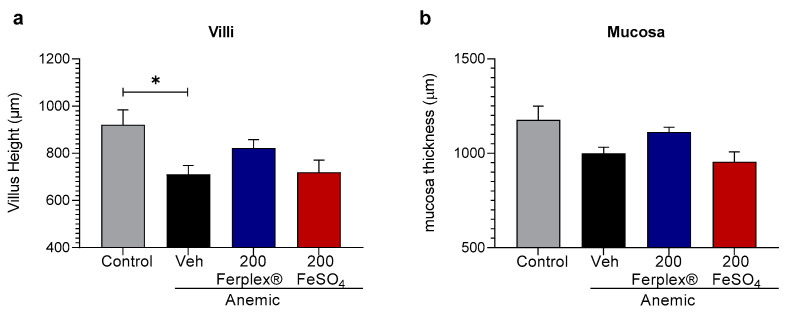
Figure 6.
Histological HE analysis of villi (a) and mucosa (b) height in duodenal samples. Data are presented as individual points and mean ± SEM. * p < 0.05 with the Kruskal-Wallis test followed by Dunnett’s multiple comparison test. N = 6 (anemic-vehicle); 8 (control); 7 (treatment groups). Veh = vehicle.

