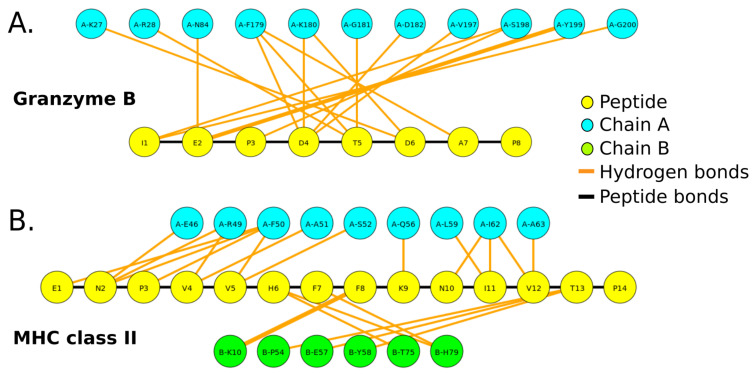
Figure 4.
Visualization of potential hydrogen bonds between a peptide and residues of the protein binding site. The graphs were generated for the protease bound to an 8-mer peptide substrate (A), and MHC class II allele bound to a 15-mer peptide (B). The yellow nodes represent the peptide amino acids, and the other nodes are the residues of the protein interacting with the peptide (colored by chain). The bonds are represented by orange lines. The width of the lines is proportional to the number of hydrogen bonds between the pair of residues.

