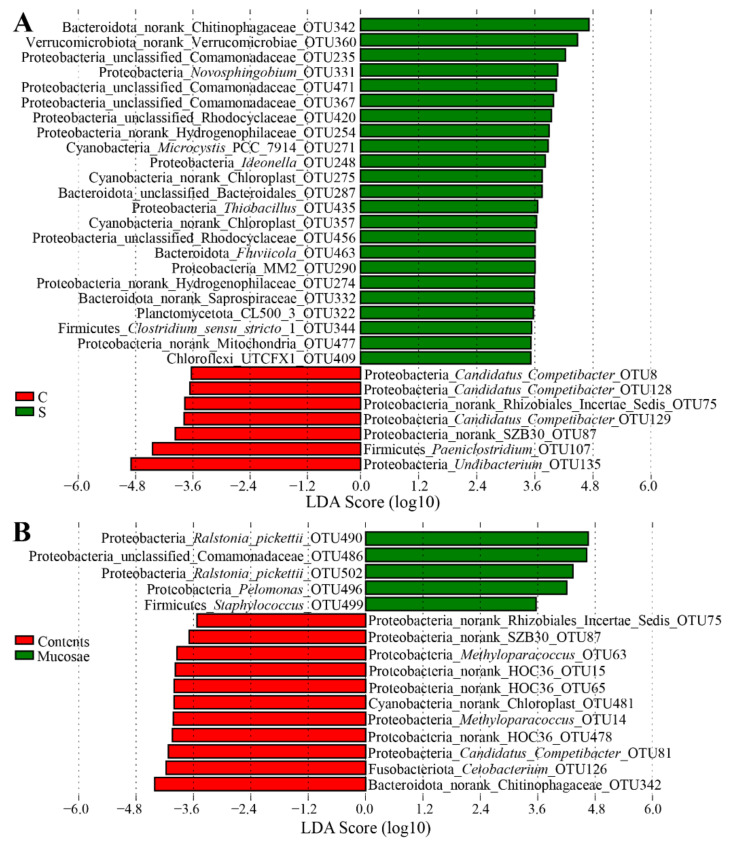
Figure 5.
(A) LEfSe showing differences in the bacterial communities at the OTU level between the stomach contents and contents. (B) LEfSe showing differences in the bacterial communities at the OTU level between the content (C and S) and mucosa (G, M, and W) samples. The highlighted taxa are enriched in the group that corresponds to each color. LDA scores can be interpreted as the degree of difference in the relative abundance of OTUs.

