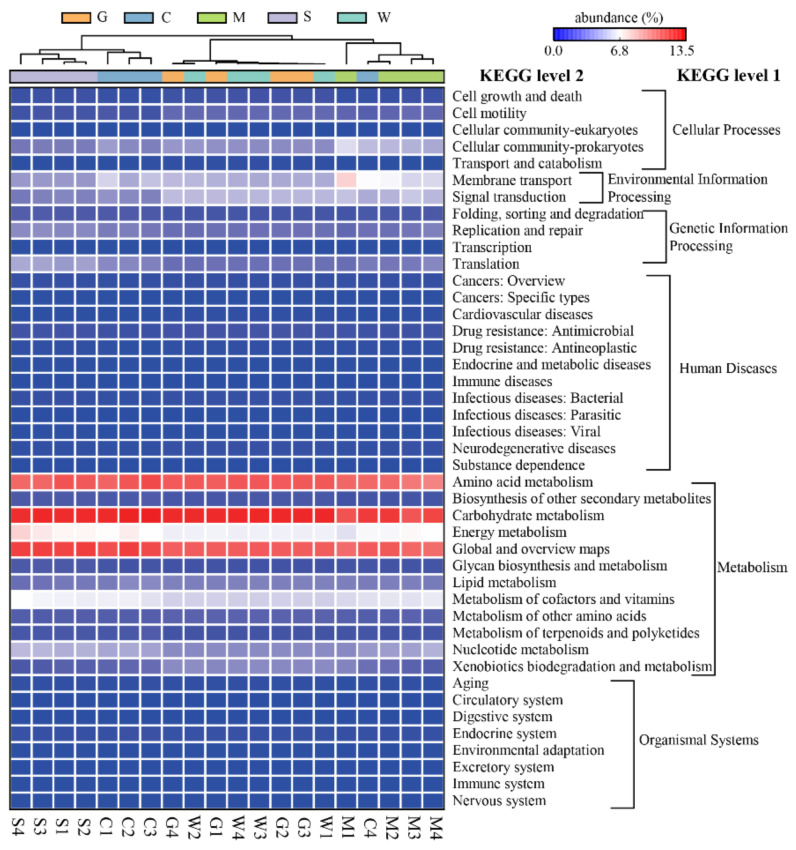
Figure 8.
Heatmap profiles showing the functional categories (Kyoto Encyclopedia of Genes and Genomes (KEGG) level 1 and level 2) of the bacterial communities, as predicted by the Phylogenetic Investigation of Communities by Reconstruction of Unobserved States (PICRUSt2) analysis. The functional clustering analysis is based on the unweighted pair-group method with arithmetic means (UPGMA). Rows represent the KEGG Orthology (KO) functions, columns represent the 20 samples, and the color intensity in the heatmap represents the relative abundance (%) of the functional categories. G: gill mucosae (G1–G4); C: intestinal contents (C1–C4); M: intestinal mucosae (M1–M4); S: stomach contents (S1–S4); W: stomach mucosae (W1–W4).

