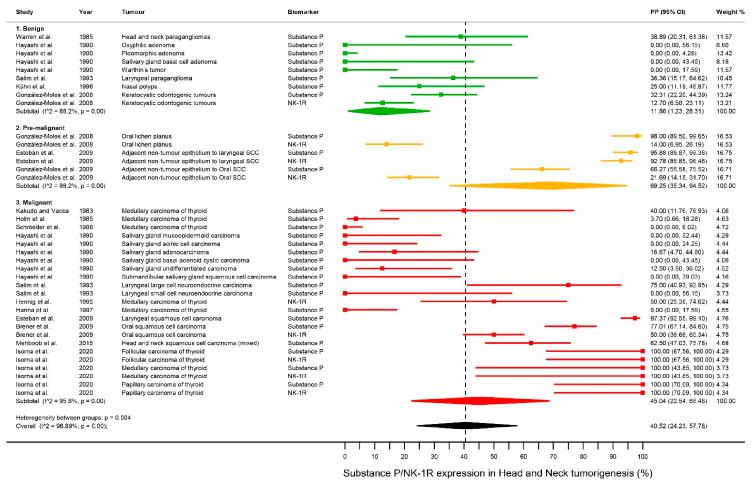
Figure 3.
Forest plot. A forest plot graphically representing the stratified meta-analysis on differential expression of SP/NK-1R in head & neck tumorigenesis by malignant behavior. ES, effect size (i.e., pooled proportions expressed as percentage); CI, confidence intervals. Random-effects model, inverse-variance weighting (based on the DerSimonian and Laird method).

