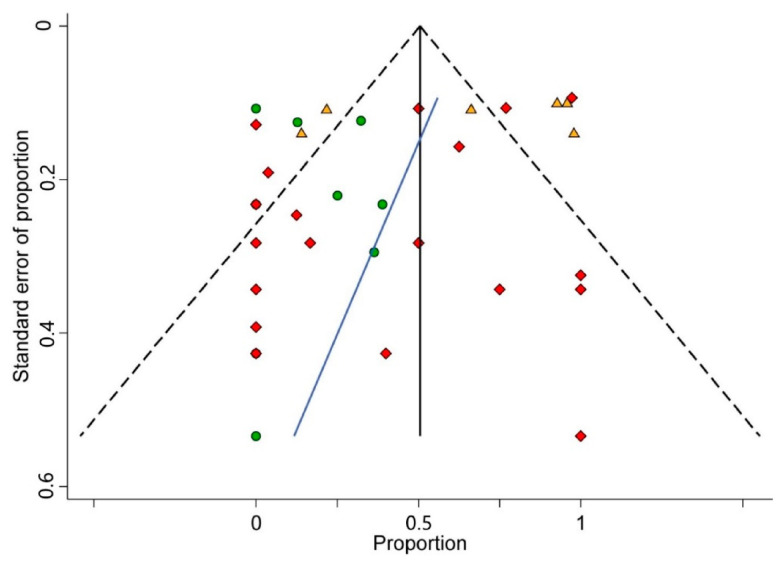
Figure 4.
Funnel plot. A funnel plot of estimated proportion of cases with high expression for SP/NK-1R against its standard error in head and neck tumorigenesis. The black vertical line corresponds to the pooled proportion of cases with high expression for SP/NK-1R. The two diagonal intermittent lines represent the pseudo-95% confidence interval. The green circles, orange triangles, and red diamonds represent the published series reporting SP/NK-1R expression in benign, pre-malignant, and malignant tumors, respectively. The blue line represents the fitted line corresponding to Egger’s regression test (p = 0.190) for funnel plot asymmetry.

