Figure 2.

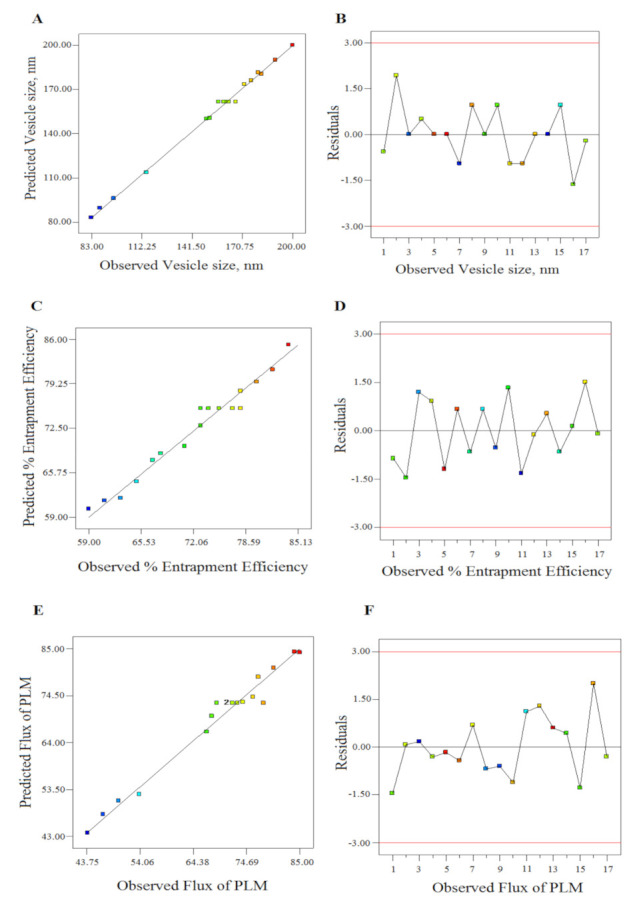
The linear correlation plots (A,C,E) between predicted vs. observed values and corresponding residual plots (B,D,F) for responses vesicle size, entrapment efficiency, and flux of plumbagin (PLM).

The linear correlation plots (A,C,E) between predicted vs. observed values and corresponding residual plots (B,D,F) for responses vesicle size, entrapment efficiency, and flux of plumbagin (PLM).