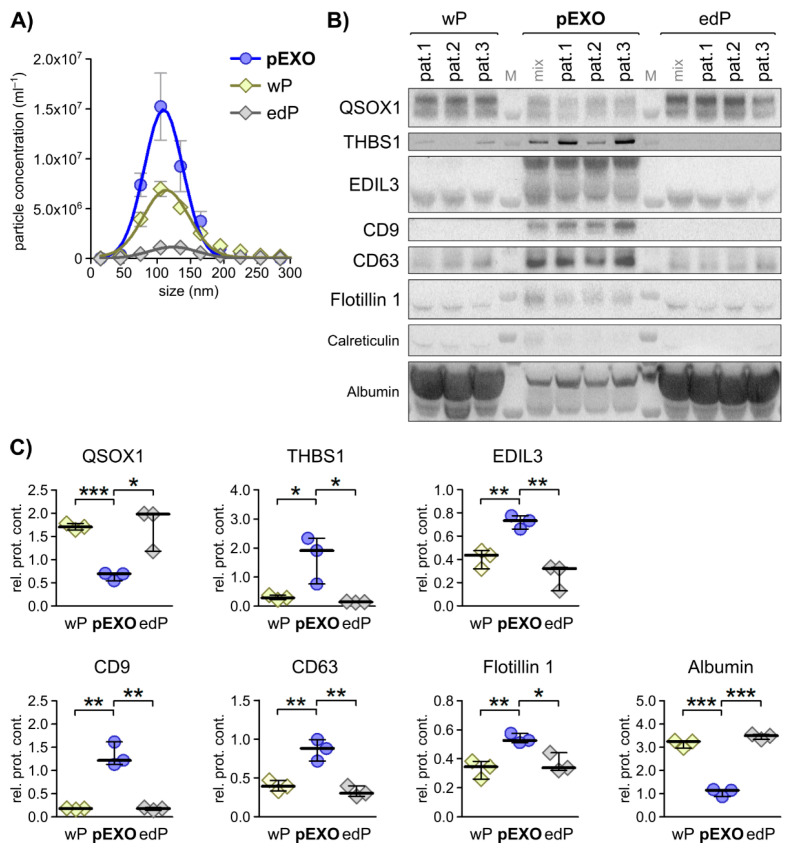
Figure 2.
Selected primary fibroblast activation status dependent EXO markers display specificity to blood EXOs in matched CRC patient plasma. (A) Particle size distribution of patient-matched plasma EXOs (pEXO) in comparison to whole plasma (wP) and EXO-depleted plasma (edP) as measured by NTA. (B) Immunoblot analysis of quiescin sulfhydryl oxidase 1 (QSOX1), thrombospondin 1 (THBS1), EGF-like repeats and discoidin domains 3 (EDIL3), the EXO markers CD9, CD63 and Flotillin 1, including calreticulin as negative control, and albumin in wP, pEXO and edP protein lysates. (C) Graphical analysis of immunoblots shown in (B) using ImageJ, comparing signal strength to pEXO mix. Unpaired t-test: * p < 0.05, ** p < 0.01, *** p < 0.001.

