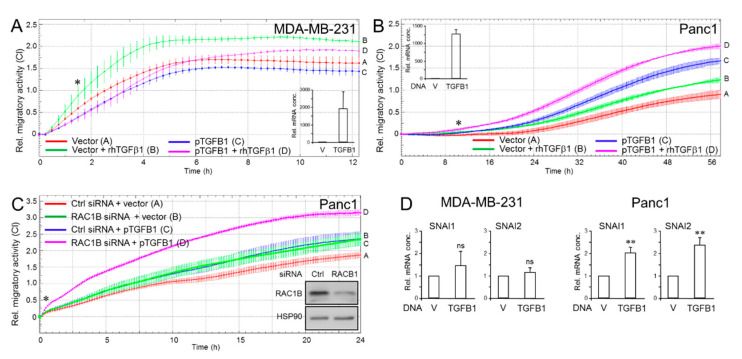
Figure 3.
Effect of ectopic overexpression of TGFB1 in MDA-MB-231 and Panc1 cells on cell motility. (A) MDA-MB-231 cells were transfected with either empty vector or an expression vector encoding TGFβ1 (pTGFB1) and 48 h later subjected to real-time measurement of random cell migration in the absence or presence of rhTGFβ1 (5 ng/mL). Differences between the green curve (tracing B) and the magenta curve (tracing D) were first significant at 1:30 (∗) and all later time points. (B) As in (A), except that Panc1 cells ectopically overexpressing TGFβ1 cells were assayed. Differences between the green curve (tracing B) and the magenta curve (tracing D) were first significant at 10:24 (∗) and all later time points. Overexpression of transfected TGFβ1 in (A,B) was validated by qPCR analysis (insets), and by ELISA with culture supernatants from pTGFB1 transfected cells with or without the addition of rhTGFβ1 (Figure S3). (C) Panc1 cells were transiently cotransfected with Ctrl siRNA or RAC1B siRNA along with either empty vector or pTGFB1. Then, 48 h later the transfectants were analyzed on the xCELLigence platform for changes in migratory activities. Differences between the green curve (tracing B) and the magenta curve (tracing D) were first significant at 1:00 (∗) and all later time points. Successful knockdown of RAC1B was verified by immunoblotting with HSP90 as loading control (inset). Data in (A–C) are the mean ± SD from 3 or 4 parallel wells. (D) QPCR analysis SNAI1 and SNAI2 in MDA-MB-231 and Panc1 cells (mean ± SD, n = 3). V, empty vector; TGFB1, TGFβ1 expression vector. Ns, not significant. *, p < 0.05; **, p < 0.01.

