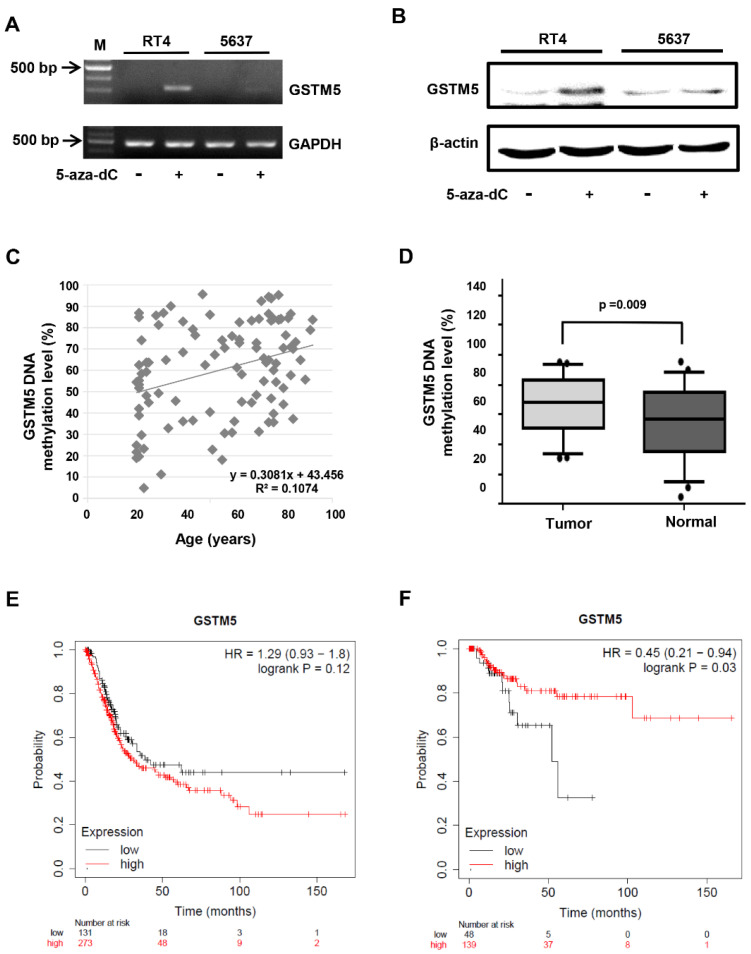
Figure 2.
The status of GSTM5 DNA methylation in bladder cancer cells and clinical samples. (A) The effect of 10 µM 5-aza-dC on GSTM5 mRNA expression. (B) The effect of 10 µM 5-aza-dC on GSTM5 protein expression. The anti-GSTM5 antibodies were Abnova H00002949-D01P. (C) Correlation between age and GSTM5 DNA methylation level in 50 bladder cancer tissues and 50 normal human urine pellets. The linear regression formula is on the bottom right (R2 = 0.1074), which was calculated by Microsoft Excel. (D) GSTM5 DNA methylation level in 50 bladder cancer tissues and 50 normal human urine pellets. The statistical results were analyzed by SigmaPlot. (E) Kaplan–Meier plot showing the overall survival probability of 404 bladder cancer patients. (F) Kaplan–Meier plot of the relapse-free survival probability of 187 bladder cancer patients.

