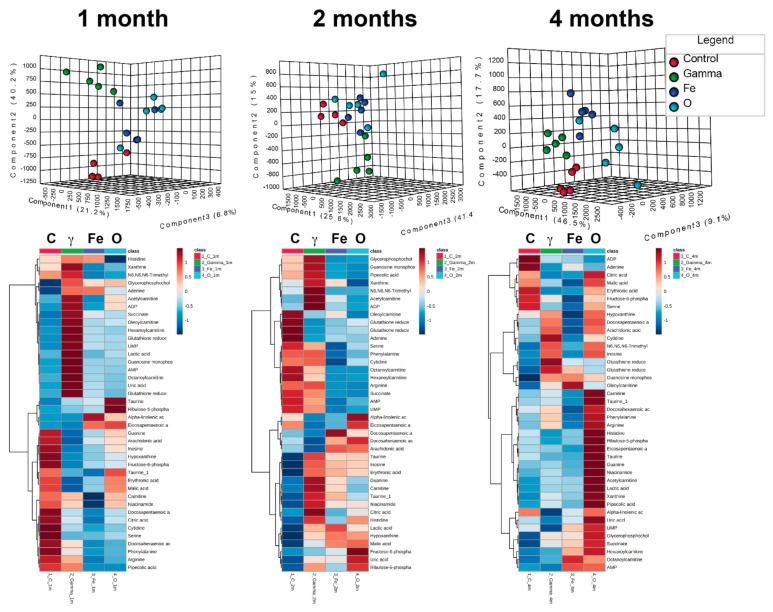
Figure 2.
Multivariate data analysis on validated metabolites. Forty metabolites were identified through MS/MS and evaluated at 1, 2, and 4 months after irradiation. Distinct clustering in the partial least squares discriminant analysis (PLS-DA) scores plots is seen in all time points, while differential levels of the individual metabolites highlight the differences between the different exposures over time.

