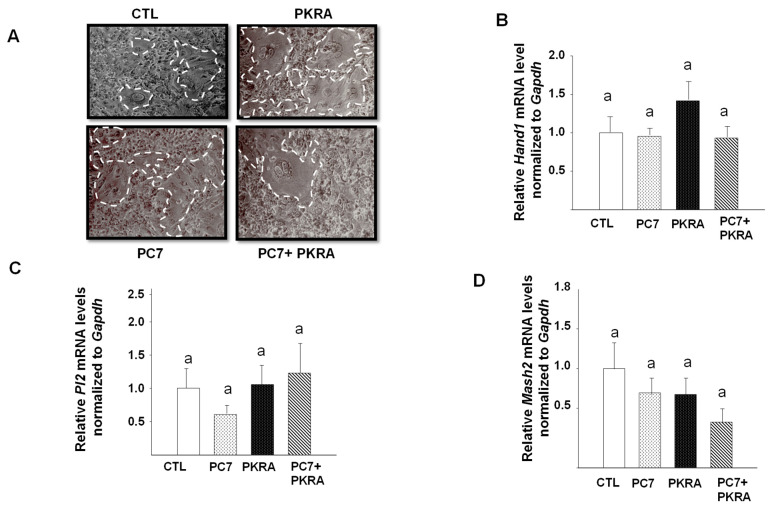
Figure 6.
Effects of prokineticin antagonists’ on RCHO-1 differentiation. (A) reports representative microphotographs of RCHO-1 cells in the absence or presence of PC7 (1 µM), PKRA (1 µM), or both. (B–D) depict comparisons of, Hand1, Placental lactogen2 and Mash2 mRNA levels, respectively on total extracts fromRCHO-1 treated or not with PC7 or PKRA or both. Gapdh was used to standardize for mRNA expression. Data are represented as mean ± SEM of three independent experiments. p < 0.05. Bars with different letters are significantly different from each other.

