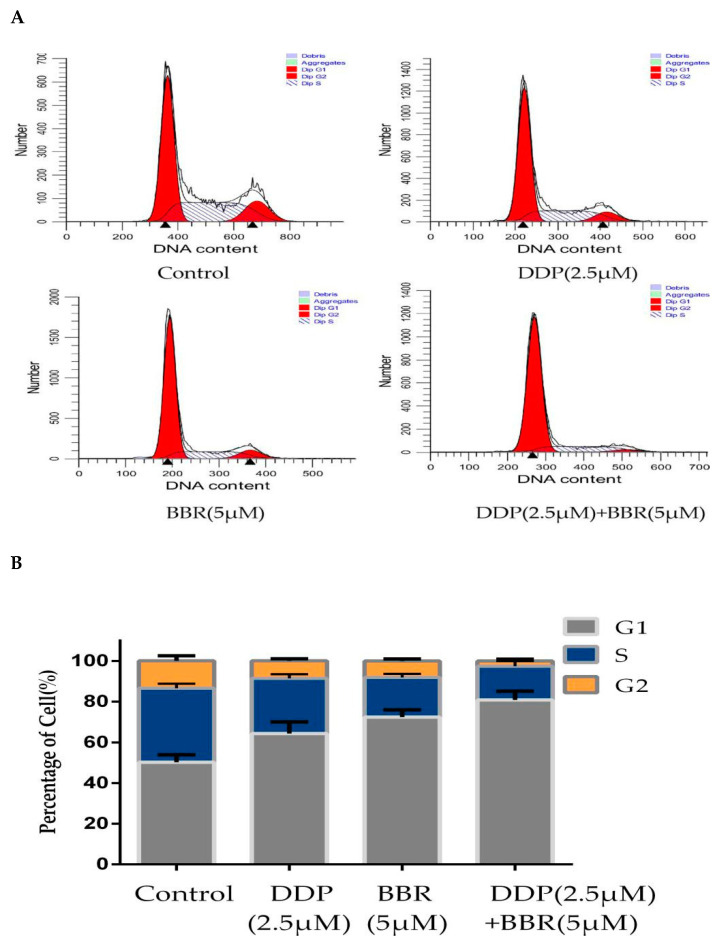
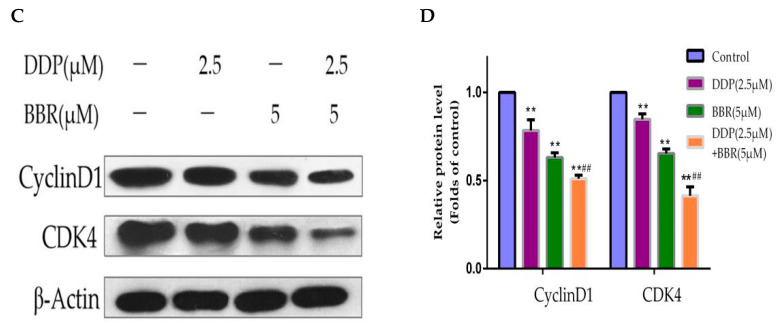
Figure 5.
Effect of BBR and DDP alone and in combination on the cell cycle. (A) MG-63 cells treated with BBR and/or DDP for 48 h. The cell cycle was evaluated by flow cytometry using PI staining. (B) Percentage of cells distributed in each phase of the cell cycle. (C,D) The levels of cleaved CyclinD1 and CDK4 were detected by Western blotting. The data are presented as the mean ± SD of three independent experiments; ** p < 0.01, compared with the control group. ## p < 0.01, compared with the monotherapy group.


