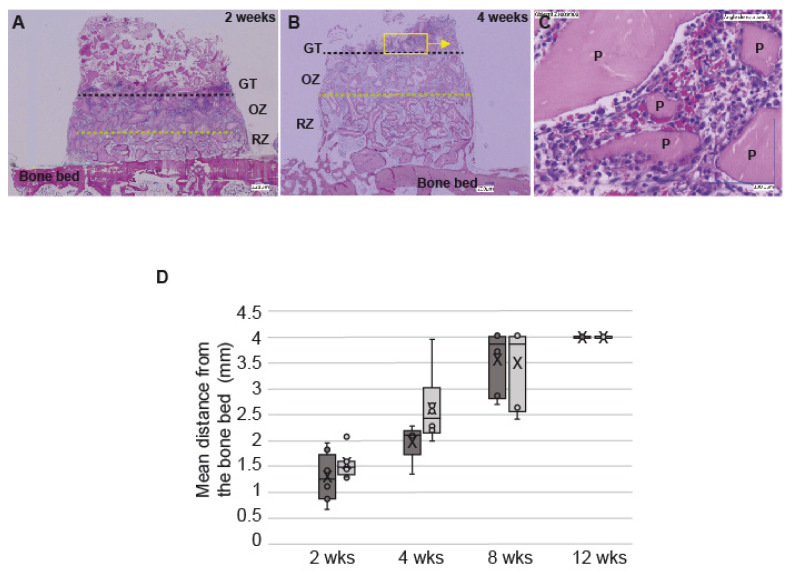
Figure 3.
Migration of the granulation tissue. (A,B) representative histological slides showing the migration of the granulation tissue within cylinders filled with DBBM-C soaked in NaCl 0.9% at 2 weeks and 4 weeks (dotted black line, mean height of the granulation tissue (GT); dotted green line, inferior limit of the osteogenic zone (OZ) upper limit of the remodeling zone (RZ). Yellow box and arrow: magnification on the picture indicated by the arrow. (C) Higher magnification of the granulation tissue showing mononuclear cells surrounding the particles of DBBM-C. (D) Box plot showing the mean distance (mm) between the bone bed and the GT in the cylinders filled with DBBM-C scaffolds either pre-treated with blood (dark grey) or NaCl 0.9% (light grey) at 2, 4, 8 and 12 wks. Horizontal line: median; Boxes: 25–75%; ×: mean; Bars: range of non-outliers.

