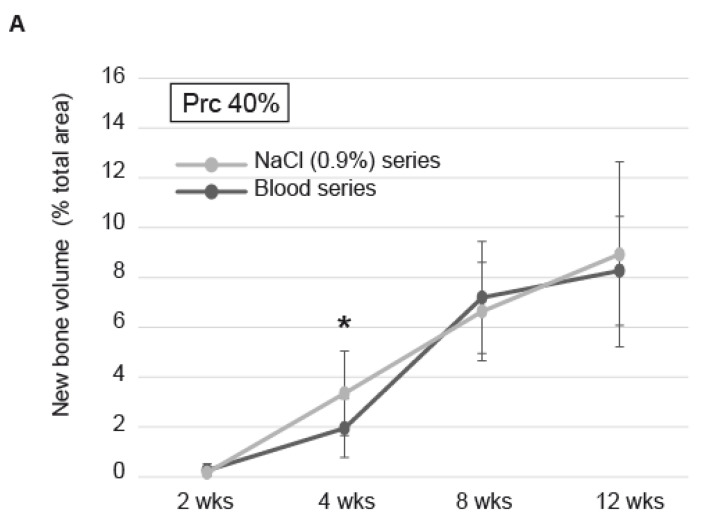
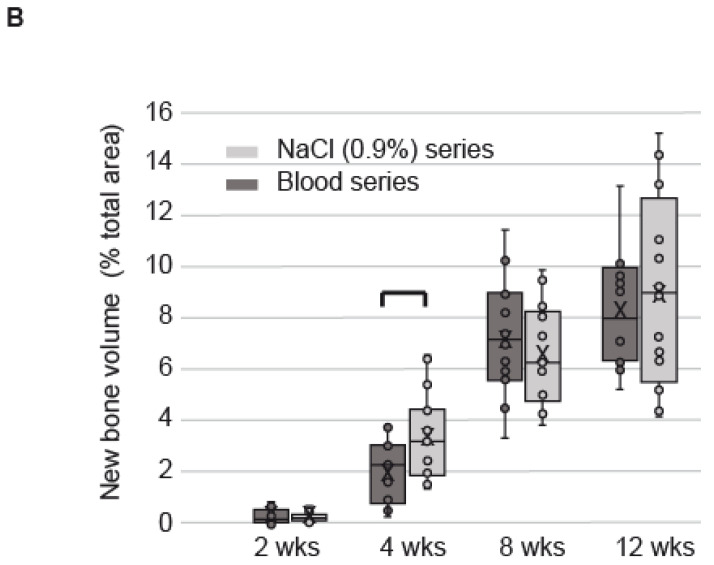
Figure 5.
Histomorphometry (A) New bone volume in the cylinders filled with DBBM-C scaffolds either pre-treated with blood (dark grey) or NaCl 0.9% (light grey) at 2, 4, 8 and 12 wks. Data are expressed as mean ± SD, *: significantly different (p < 0.05) (n = 6 per treatment at each time point). (B) Box plots showing the new bone volume in the cylinders filled with DBBM-C scaffolds either pre-treated with blood or NaCl 0.9% at 2, 4, 8 and 12 wks. Horizontal line: median; Boxes: 25–75%; ×: mean; Bars: range of non-outliers. Brackets: significantly different (p < 0.05).


