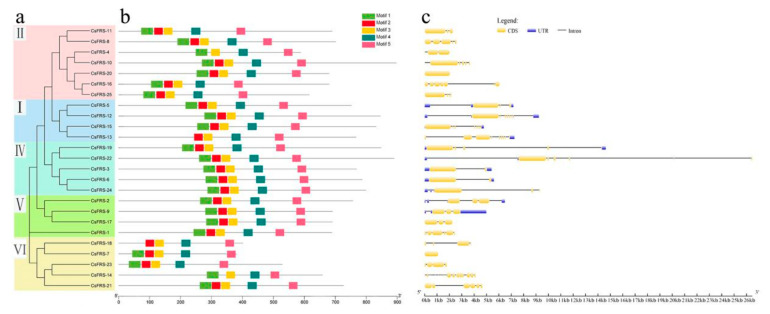
Figure 2.
Comparative gene structure and motif analysis of CsFHY3/FAR1s. (a) Phylogenetic analysis and classification of CsFHY3/FAR1s. The subtree branch lines are colored in order to indicate the different subfamilies. (b) Motif analysis of CsFHY3/FAR1s. The top five motifs identified from the tea plant proteins obtained by the MEME analysis. (c) Exon-intron structures of CsFHY3/FAR1s. The exons are marked as yellow boxes, and the introns are represented by black lines; UTRs are shown as blue boxes.

