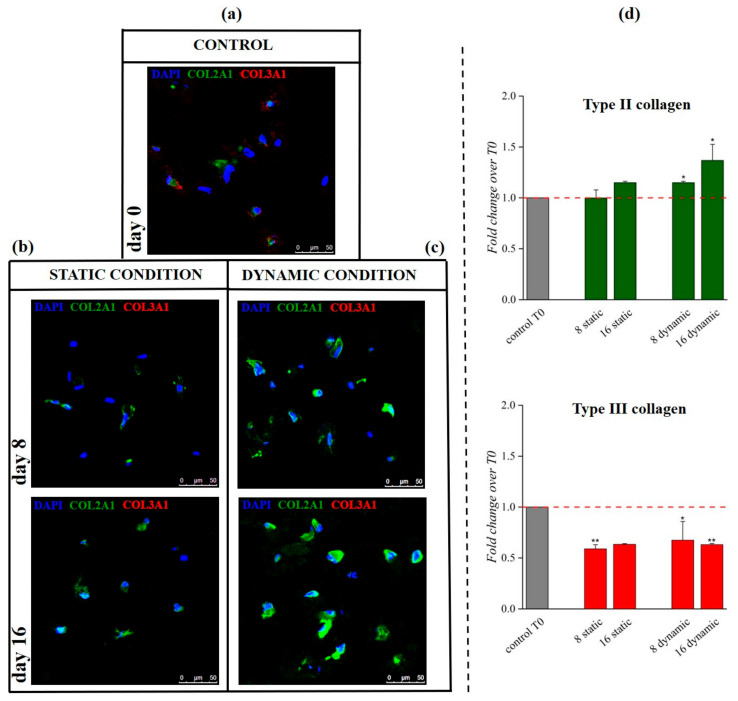
Figure 8.
Immunofluorescence images and semiquantitative analysis of type II and III collagen signals in both static and dynamic 3D culture. IF assay at day 8 and 16 of static (b) and dynamic (c) culture showed an increase in type II collagen signal (green) especially in dynamic culture at day 16; type III collagen signal (red) was detected in the control sample at day 0 (a), but it decreased at the other time points. Q-IF confirmed this trend, indicating a statistically significant increase of type II collagen protein (stained in green) at day 16 in dynamic culture coupled with a significant reduction in type III collagen signal (stained in red) (d). Split channels and other IF data on type I collagen are reported in Supplementary Material. Scale bar: 50 µm. * p < 0.05, ** p < 0.01, (one-way ANOVA, n = 3).

