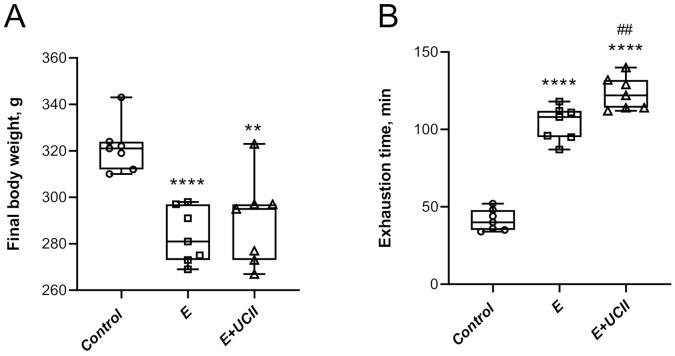
Figure 1.
The effect of UCII on body weight (A) and exhaustion time (B) in exercised rats. Box and Whisker plots show median, min, and max values. ANOVA and Tukey’s post-hoc test were used to compare the results among different treatment groups. Statistical Scheme ** p < 0.01; **** p < 0.0001 compared to the control group and ## p < 0.01 compared to the exercise group. UCII, Undenatured type II collagen. Control (Circle): no exercise and no UCII, E (Square): exercised rats, E + UCII (triangle), exercised rats receiving 4 mg/kg BW/day UCII.

