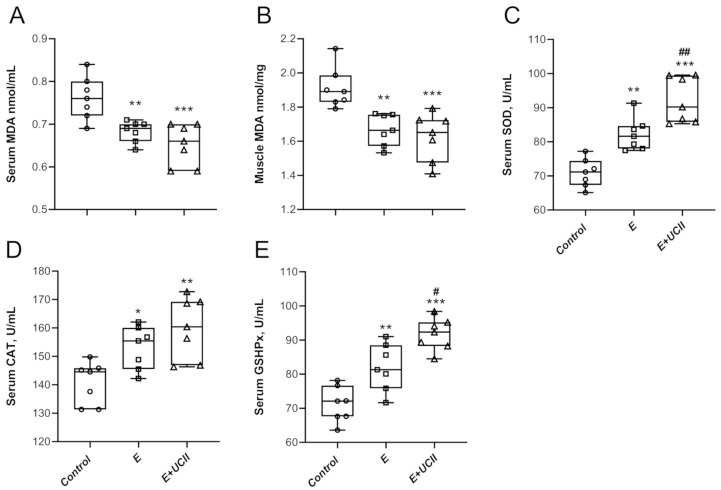
Figure 3.
The effects of UCII on the serum MDA (A), muscle MDA (B), serum SOD (C), CAT (D), and GSHPx (E) levels in exercised rats. Box and Whisker plots show median, min, and max values. ANOVA and Tukey’s post-hoc test were used to compare the results among different treatment groups. Statistical significance between groups is shown by: * p < 0.05, ** p < 0.01, *** p < 0.001 compared as control group and # p < 0.05, ## p < 0.01 compared as exercise Group. UCII, Undenatured type II collagen; MDA, malondialdehyde; SOD, superoxide dismutase, CAT, catalase; GSHPx, glutathione peroxidase, Control (Circle): no exercise and no UCII, E (Square): exercised rats, E + UCII (triangle), exercised rats receiving 4 mg/kg BW/day UCII.

