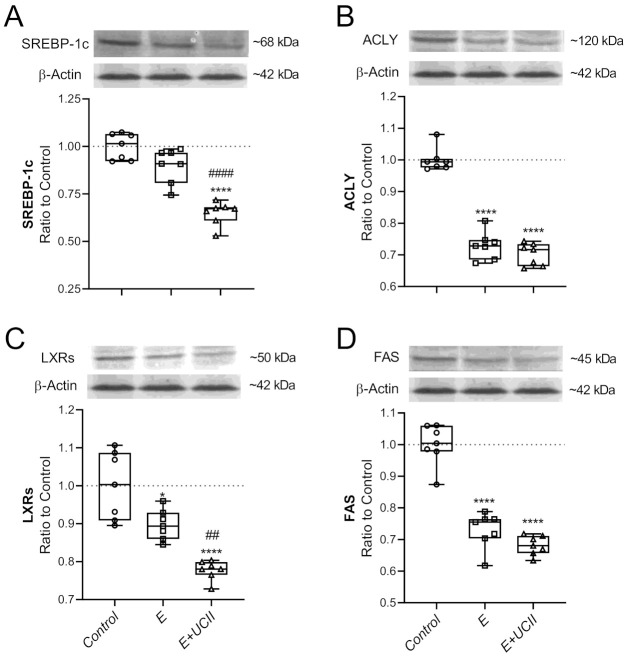
Figure 4.
The effect of UCII on the muscle SREBP-1c (A), ACLY (B), LXRs (C), and FAS (D) levels in exercised rats. The densitometric analysis of the relative intensity according to the control group of the western blot bands (Figure S1) was performed with β-actin normalization to ensure equal protein loading. Blots were repeated at least three times (n = 3), and a representative blot is shown. Box and Whisker plots show median, min, and max values. Data are expressed as a ratio of the control set at 1.0. ANOVA and Tukey’s post-hoc test were used to compare the results among different treatment groups. Statistical significance between groups is shown by: * p < 0.05; **** p < 0.0001 compared as control group and, ## p < 0.01; #### p < 0.0001 compared as exercise group. E: Exercise; UCII, Undenatured type II collagen; SREBP-1c, Sterol regulatory element-binding protein 1c; ACLY, ATP citrate lyase; LXRs, Liver X receptors; FAS, Fatty acid synthase, Control (Circle): no exercise and no UCII, E (Square): exercised rats, E + UCII (triangle), exercised rats receiving 4 mg/kg BW/day UCII.

