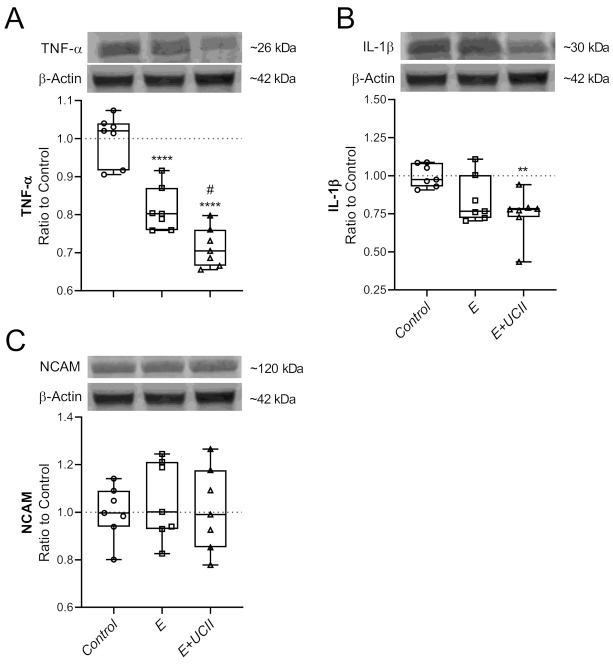
Figure 6.
The effect of UCII on the muscle TNF-α (A), IL-1β (B), and NCAM (C) levels in exercised rats. The densitometric analysis of the relative intensity according to the control group of the western blot bands (Figure S3) was performed with β-actin normalization to ensure equal protein loading. Blots were repeated at least three times (n = 3), and a representative blot is shown. Box and Whisker plots show median, min, and max values. Data are expressed as a ratio of the control set at 1.0. ANOVA and Tukey’s post-hoc test were used to compare the results among different treatment groups. Statistical significance between groups is shown by: ** p < 0.01; **** p < 0.0001 compared to the control group and, # p < 0.05 compared to the exercise group. E: Exercise; UCII, Undenatured type II collagen; TNF-α, Tumor necrosis factor-α; IL-1β, Interleukin-1β; NCAM, Neural cell adhesion molecules, Control (Circle): no exercise and no UCII, E (Square): exercised rats, E + UCII (triangle), exercised rats receiving 4 mg/kg BW/day UCII.

