Figure 2.
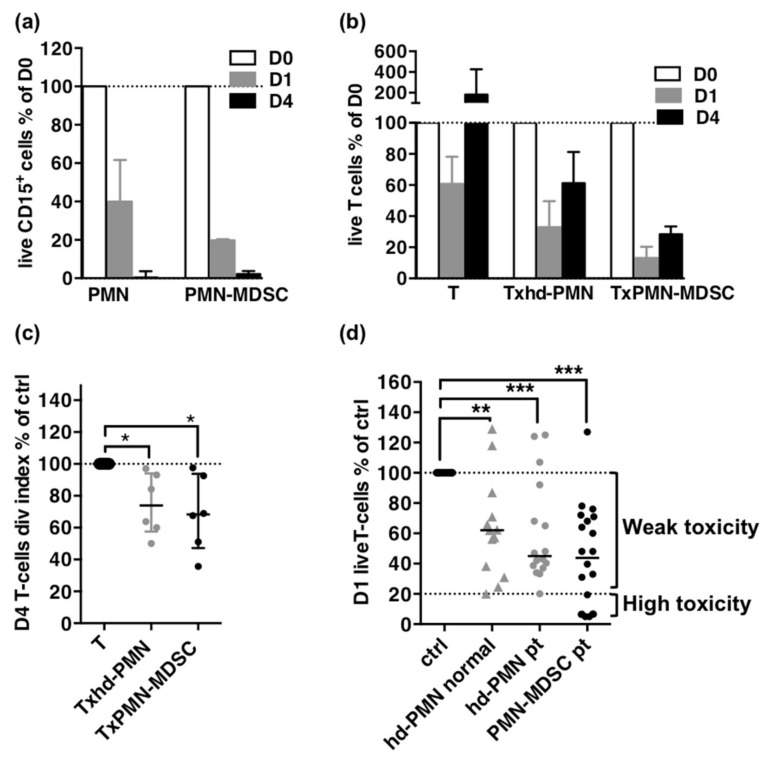
Suppression as direct cytotoxicity on T cells. (a) Follow-up of CD15+ cells during the proliferation assay. Percentages of day 0 absolute counts of live CD15+ cells on day 1 and day 4. (b) Follow-up of T cells during the proliferation assay. Percentages of day 0 absolute counts of T cells on day 1 and day 4. (c) Proliferation of T cells on day 4 as percentage of control T cells division index. For (a–c): high-density PMNs, n = 6; PMN-MDSCs, n = 5. (d). Cytotoxicity of high-density PMNs from healthy donor (hd-PMN HD, n = 13) or patients (hd-PMN pt, n = 16) and of PMN-MDSCs (n = 20) as percentages of control T cells survival in overnight co-cultures. The minimum value reached by high-density PMNs (20%) indicated by a dotted line constitute the threshold between weak and high cytotoxicity for PMN-MDSCs. Medians and IQR for (a–c); median for (d). p-values of Mann-Whitney U-tests for (a,b) and of Wilcoxon matched pairs-tests for (c,d) are indicated on top of pairs: *, p < 0.05; **, p < 0.01; *** p < 0.001.

