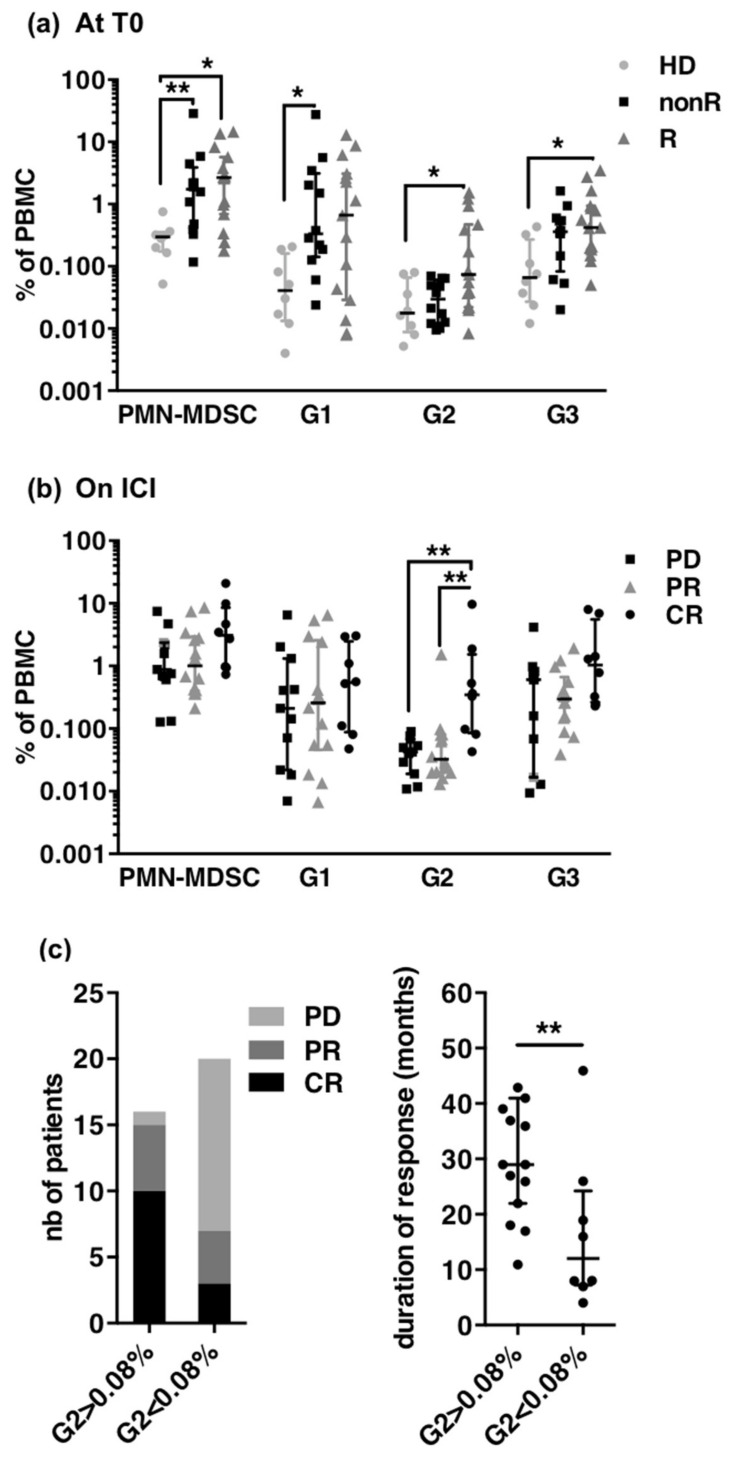
Figure 6.
Frequencies of PMN-MDSC subsets in melanoma patients treated with ICI. (a) Frequencies of PMN-MDSCs, G1, G2 and G3 in PBMCs of HD (healthy donors, n = 8) and patients at treatment start according to best response achieved, non R (non responders, n = 12; 11 PD, 1 SD), R (responders, n = 15; 6 PR, 9 CR). Median and IQR. p-values of Dunn’s multiple comparison post Kruskall–Wallis test are indicated on top of pairs: p < 0.05 *; p < 0.01 **. (b) Frequencies of PMN-MDSCs, G1, G2 and G3 in patients according to the radiological response at the time of sampling (CR, n = 7; PR n = 11; PD n = 10; SD n = 1). Median and IQR, p-values of Dunn’s multiple comparison post Kruskall-Wallis test are indicated on top of pairs: p < 0.05 *; p < 0.01 **. (c) Radiological response (left) and mean duration of response (right) in patients according to G2 frequency above (n = 16, including 10 CR and 5 PR) or below (n = 20, including 3 CR and 4 PR responders) the threshold of 0.08%. p-values of Mann-Whitney U-tests are indicated on top of pairs: p < 0.01 **.

