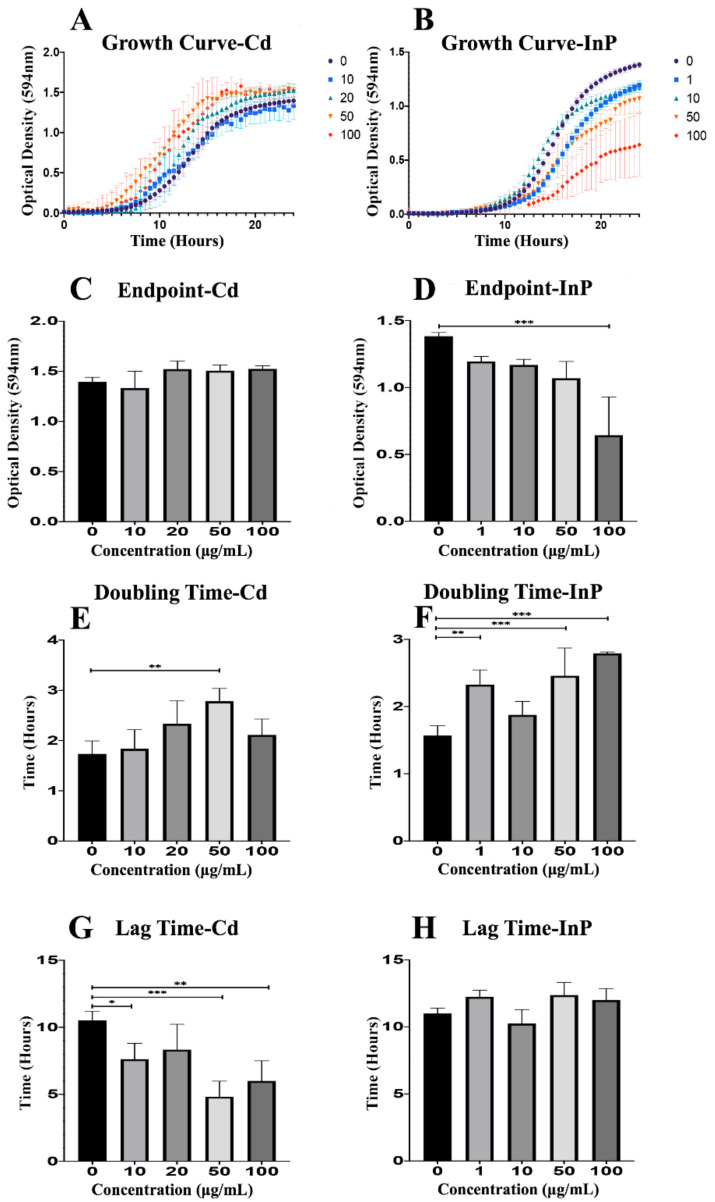
Figure 1.
Growth assay to determine growth rates of CdSe/ZnS and InP/ZnS-treated yeast cells. (A,B) Quantification of cell optical densities over a 24-h period where the cells are treated with CdSe/ZnS and InP/ZnS quantom dots (QDs), respectively, at 30 °C while shaking. (C,D) Measurement of cell optical densities at 24 h of treatment with CdSe/ZnS and InP/ZnS QDs, respectively. The bar representing the average optical densities (ODs) (594 nm) of each concentration at the 24-h mark. (E,F) Doubling time takes place during the phase of exponential growth for the cells treated with CdSe/ZnS and InP/ZnS QDs, respectively, and was measured as the amount of time it takes for cells to double their ODs. (G,H) The mean lag time before the exponential growth phase. Significant statistical differences are represented with *(p < 0.05), **(p < 0.01), and ***(p < 0.001).

