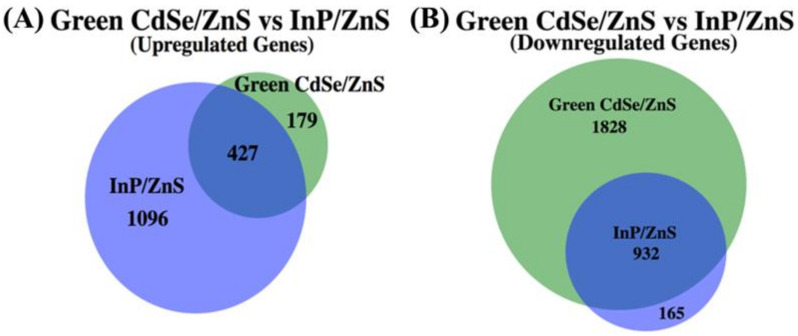
Figure 7.
A proportionately accurate Venn-diagram that represents the number of up- and downregulated genes whose expression has been significantly changed when exposed to CdSe/ZnS QDs or InP/ZnS QDs. The overlapped segments of each Venn-diagram represent genes that are differentially expressed when exposed to CdSe/ZnS and InP/ZnS QDs. The portions of the Venn-diagram that do not overlap are up- or downregulated genes that become differentially expressed only when exposed to CdSe/ZnS QDs or InP/ZnS QDs. (A) Every gene whose expression was significantly increased when compared to the normal gene expression in yeast cells when exposed to CdSe/ZnS or InP/ZnS QDs. (B) Every gene whose expression was significantly decreased when exposed to CdSe/ZnS or InP/ZnS QDs.

