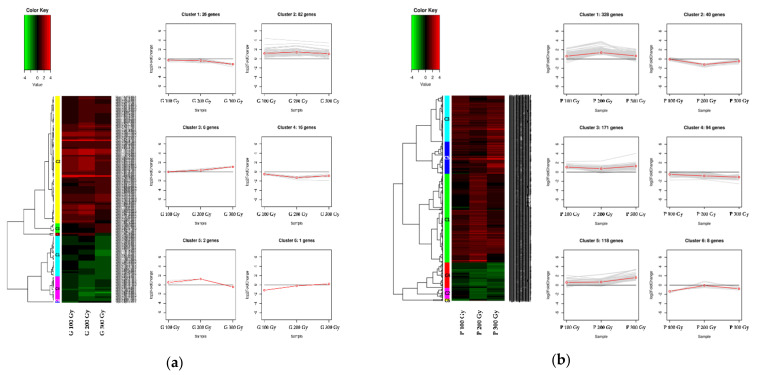
Figure 5.
As a result of clustering analysis, heatmaps showing the level of differential expression of genes in each cluster. (a) Gamma-ray treatments; (b) proton-beam treatments. The line plot is a pattern representing the clusters expressed in the heatmaps. Up or down-regulated ranges from black to red (or green) with a fold-change scale bar shown above the heatmap.

