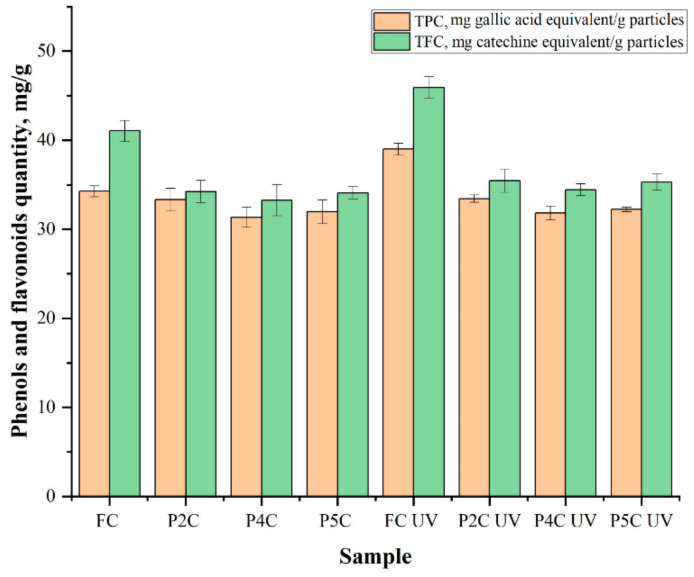
Figure 9.
The total content of phenols (orange) and flavonoids (green) in free curcumin (FC) and the curcumin extracted from the P2C, P4C, and P5C samples that were irradiated and non-irradiated with UVA. Results were expressed as mean value ± standard deviation (SD). The samples exposed to UVA light were noted with P2CUV, P4CUV, or P5CUV and FCUV.

