Figure 1.
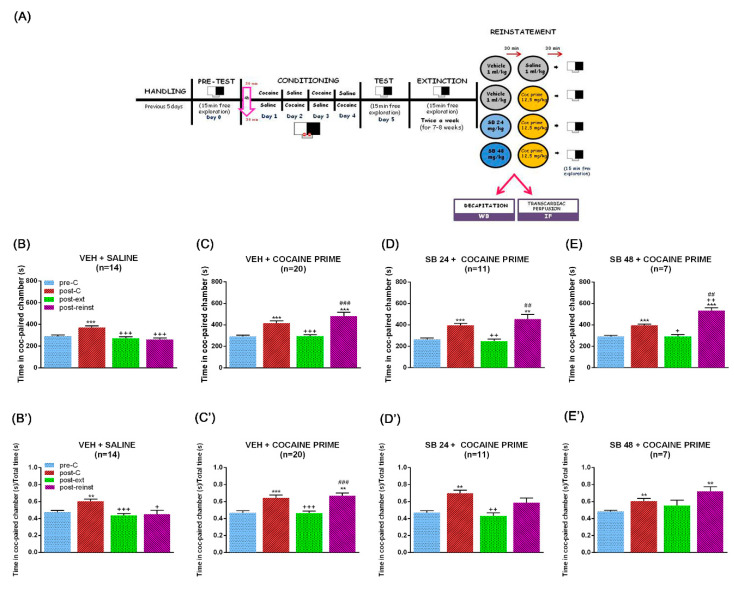
Timeline of the behavioural experimental procedure and effects of selective dopamine type 3 receptor (D3DR) blockade with SB-277011-A (24 or 48 mg/kg i.p.) on the reinstatement of conditioned place preference (CPP) induced by cocaine-priming. (A) Schematic representation showing the behavioural procedure. After 5 habituation and handling days, on day 0 animals were placed in the central corridor and allowed to explore the apparatus freely for 15 min. For each mouse, one chamber was randomly chosen to be paired with cocaine and the other chamber with saline. During days 1–4, animals were treated with cocaine and saline (conditioning sessions). The CPP test was conducted on day 5, exactly as in the preconditioning phase. Once achieved the criterion of extinction, a second session was performed 48 h later in order to confirm extinction. One day after the second extinction test, different groups of mice received vehicle or SB-277011-A (24 or 48 mg/kg i.p.) 30 min before saline or a cocaine prime dose. Fifteen min after saline or cocaine prime, mice were allowed to explore the apparatus freely (reinstatement test) and were sacrificed 15 min later, immediately after the reinstatement. (B–E) show the mean preference time spent in the cocaine-paired chamber during the pre-conditioning (pre-C), post-conditioning (post-C), post-extinction (post-ext) and reinstatement (post-reinst) in male mice pretreated with vehicle plus saline (B), vehicle plus cocaine prime (C) and SB-277011-A (24 or 48 mg/kg i.p.) plus cocaine prime ((D,E), respectively). (B’–E’) show the mean ratio of preference between the time spent in the cocaine-paired chamber and the total time spent in both chambers during the pre-C, post-C, post-ext, and reinst tests in male mice pretreated with vehicle plus saline (B’), vehicle plus cocaine prime (C’), and SB-277011-A (24 or 48 mg/kg i.p.) plus cocaine prime ((D’,E’), respectively).** p < 0.01, *** p < 0.001 vs. pre-C; + p < 0.05, ++ p < 0.01, +++ p < 0.001 vs. post-C; ## p < 0.01, ### p < 0.001 vs. post-ext. Each bar corresponds to mean ± standard error of the mean (n = 7–20 per group).

