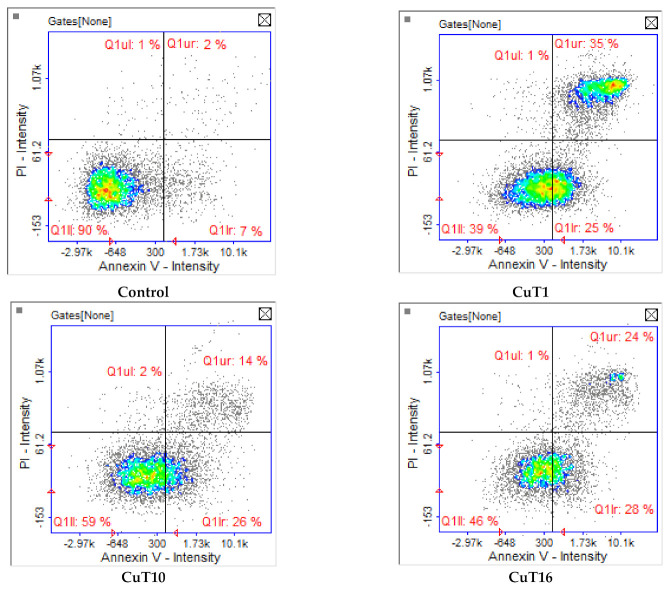
Figure 6.
Apoptosis/necrosis detection by image cytometry. A375 cells were treated with CuT1, Cu10, CuT16 in concentrations corresponding to IC50 values (69.92, 26.05, and 144.60 µM respectively) or DMSO as vehicle in control cultures. The results show one representative experiment of three independently performed. Q1II—live, Q1Ir—early apoptotic, Q1ur—late apoptotic, and Q1uI—necrotic cells.

