Figure 7.

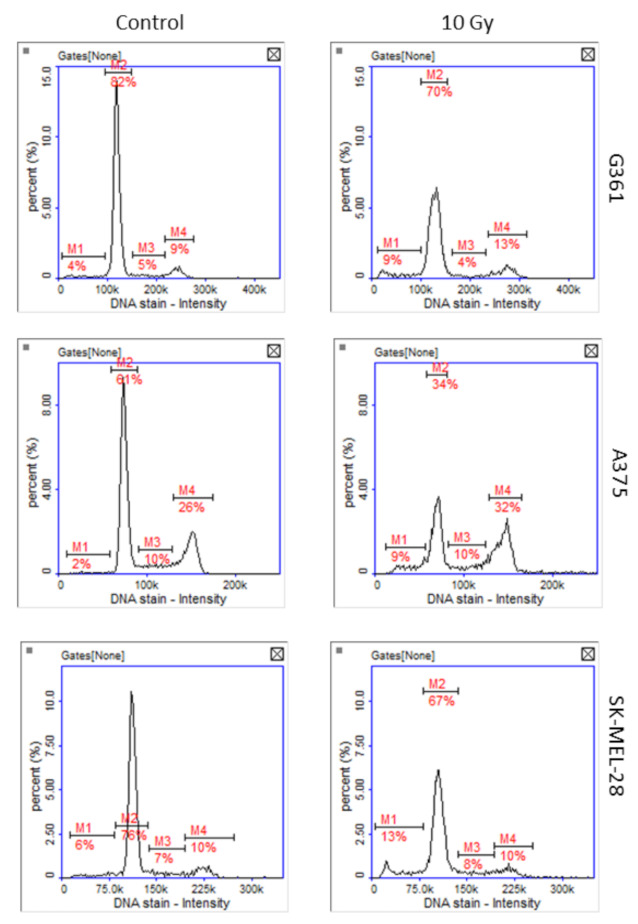
Representative histograms of cell cycle analysis obtained for G361, A375, and SK-MEL-28 melanoma cells 48 h after X-ray exposure (10 Gy, M1: subG1, M2: G1, M3: S, M4: G2/M phase).

Representative histograms of cell cycle analysis obtained for G361, A375, and SK-MEL-28 melanoma cells 48 h after X-ray exposure (10 Gy, M1: subG1, M2: G1, M3: S, M4: G2/M phase).