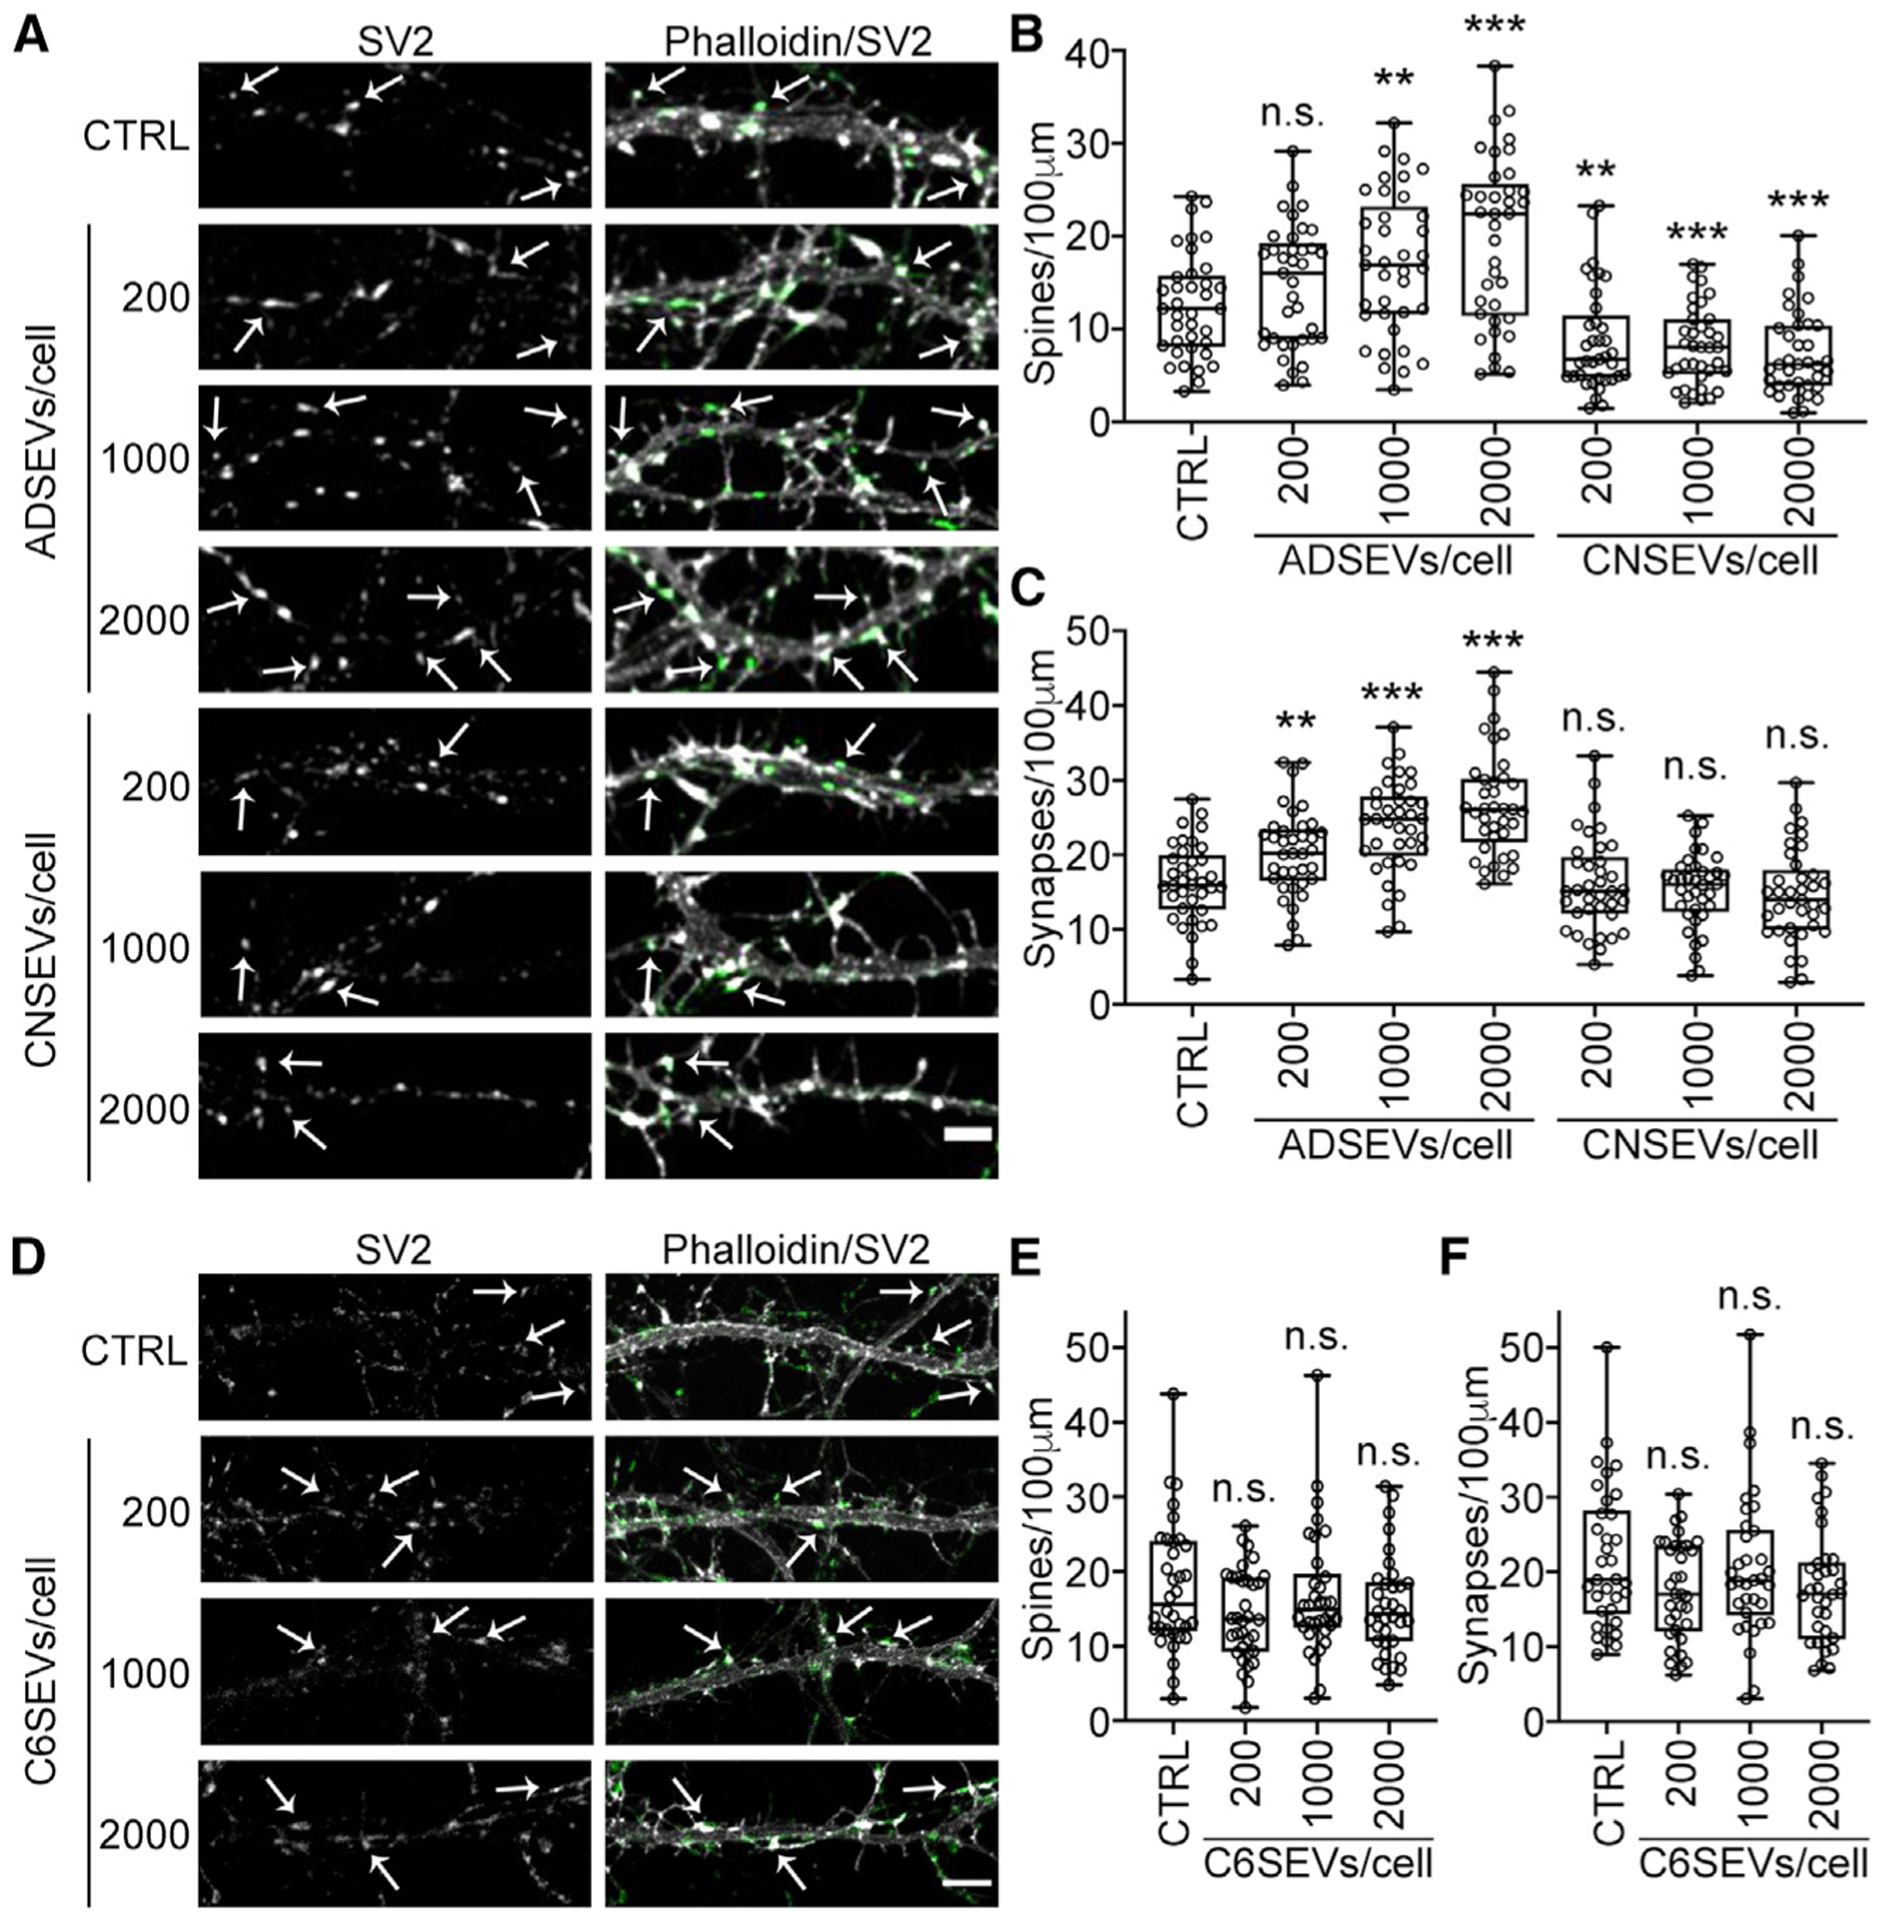
Figure 1. Astrocyte-derived SEVs promote dendritic spine and synapse formation.

(A and D) Representative fluorescence images of dendrites in day 12 neurons treated for 48 h with 0 (control), 200, 1,000, or 2,000 astrocyte-derived (ADSEVs), cortical neuron-derived (CNSEVs), or C6 glioma-derived (C6SEVs) SEVs /neuron. Images in (A) and (D) are adjusted for brightness and contrast and cropped to same size using Fiji for better visualization of SV2 colocalization on dendritic spines. Left panel: SV2 only. Right panel: overlay of phalloidin (grayscale) and SV2 (green). Example dendritic spines are indicated with arrows. Scale bars, 5 μm. (B, C, E, and F) Quantification of spine and synapse density from images. n ≥ 36 primary or secondary dendrites from 3 independent experiments. Data represented as box and whiskers plots with all data points shown, bar indicating the median, and the box showing interquartile range. **p < 0.01, ***p < 0.001; n.s., not significant.
