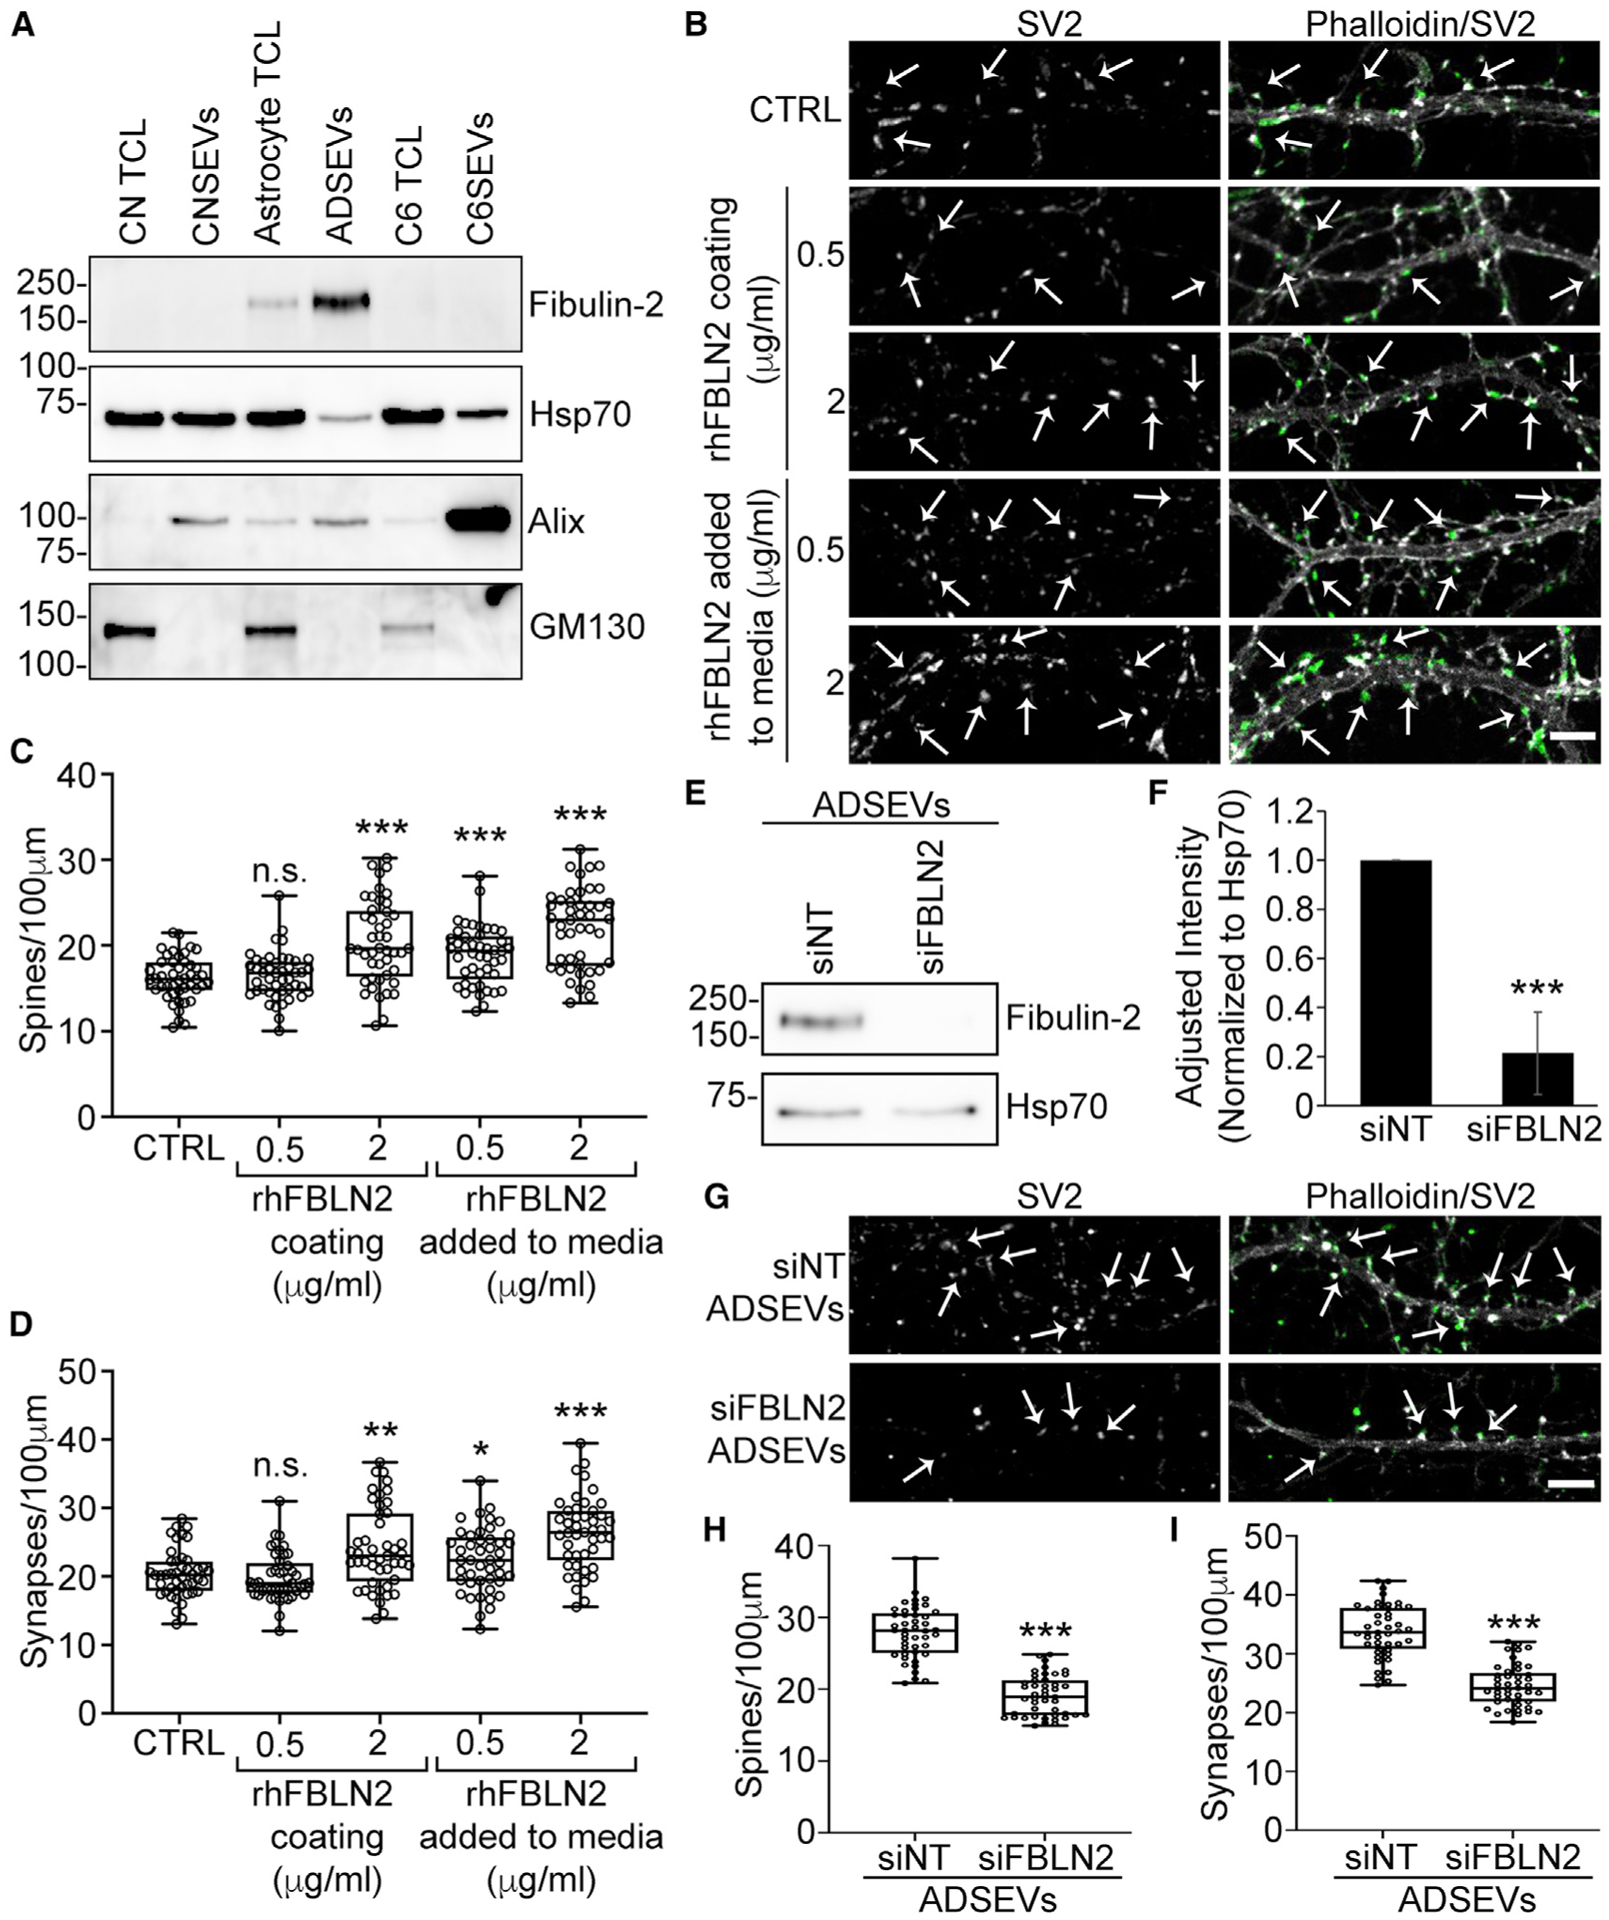
Figure 3. Fibulin-2 is a synaptogenic cargo present in astrocyte SEVs.

(A) Western blot of equal protein (10 μg) of cortical neurons, astrocytes and C6 total cell lysates (TCLs) and SEVs stained for fibulin-2, the SEV markers Hsp70 and Alix, or the Golgi marker GM130. n = 3 (quantification in Figure S2E).
(B) Representative images from day 12 cortical neurons plated on coverslips coated with poly-D-Lysine (control) in the presence or absence of soluble recombinant human fibulin-2 (rhFBLN2) added to media or plated on coverslips coated with rhFBLN2 for 48 h. Scale bar, 5 μm.
(C and D) Quantification of spines and synapses from images. n = 45 primary or secondary dendrites from 3 independent experiments.
(E) Representative western blot of control (siNT) and fibulin-2 knockdown (siFBLN2) ADSEVs stained for fibulin-2 and SEV marker Hsp70.
(F) Quantification of fibulin-2 levels in siNT and siFBLN2 ADSEVs. n = 3. Data are normalized to Hsp70 levels and represented as mean ± SEM.
(G) Representative images of day 12 neuronal dendrites treated for 48 h with 2,000 siNT/siFBLN2 ADSEVs per neuron. Images in (B) and (G) are adjusted for brightness and contrast and cropped to same size using Fiji for better visualization of SV2 colocalization on dendritic spines. Left panel: SV2 only. Right panel: overlay of phalloidin in grayscale and SV2 in green. Example dendritic spines are indicated with arrows. Scale bar, 5 μm.
(H and I) Quantification of spine and synapse density from images. n = 45 primary or secondary dendrites from 3 independent experiments. Data represented as box and whiskers plots with all data points shown, bar indicating the median, and the box showing interquartile range. *p < 0.05, **p < 0.01, ***p < 0.001; n.s., not significant.
