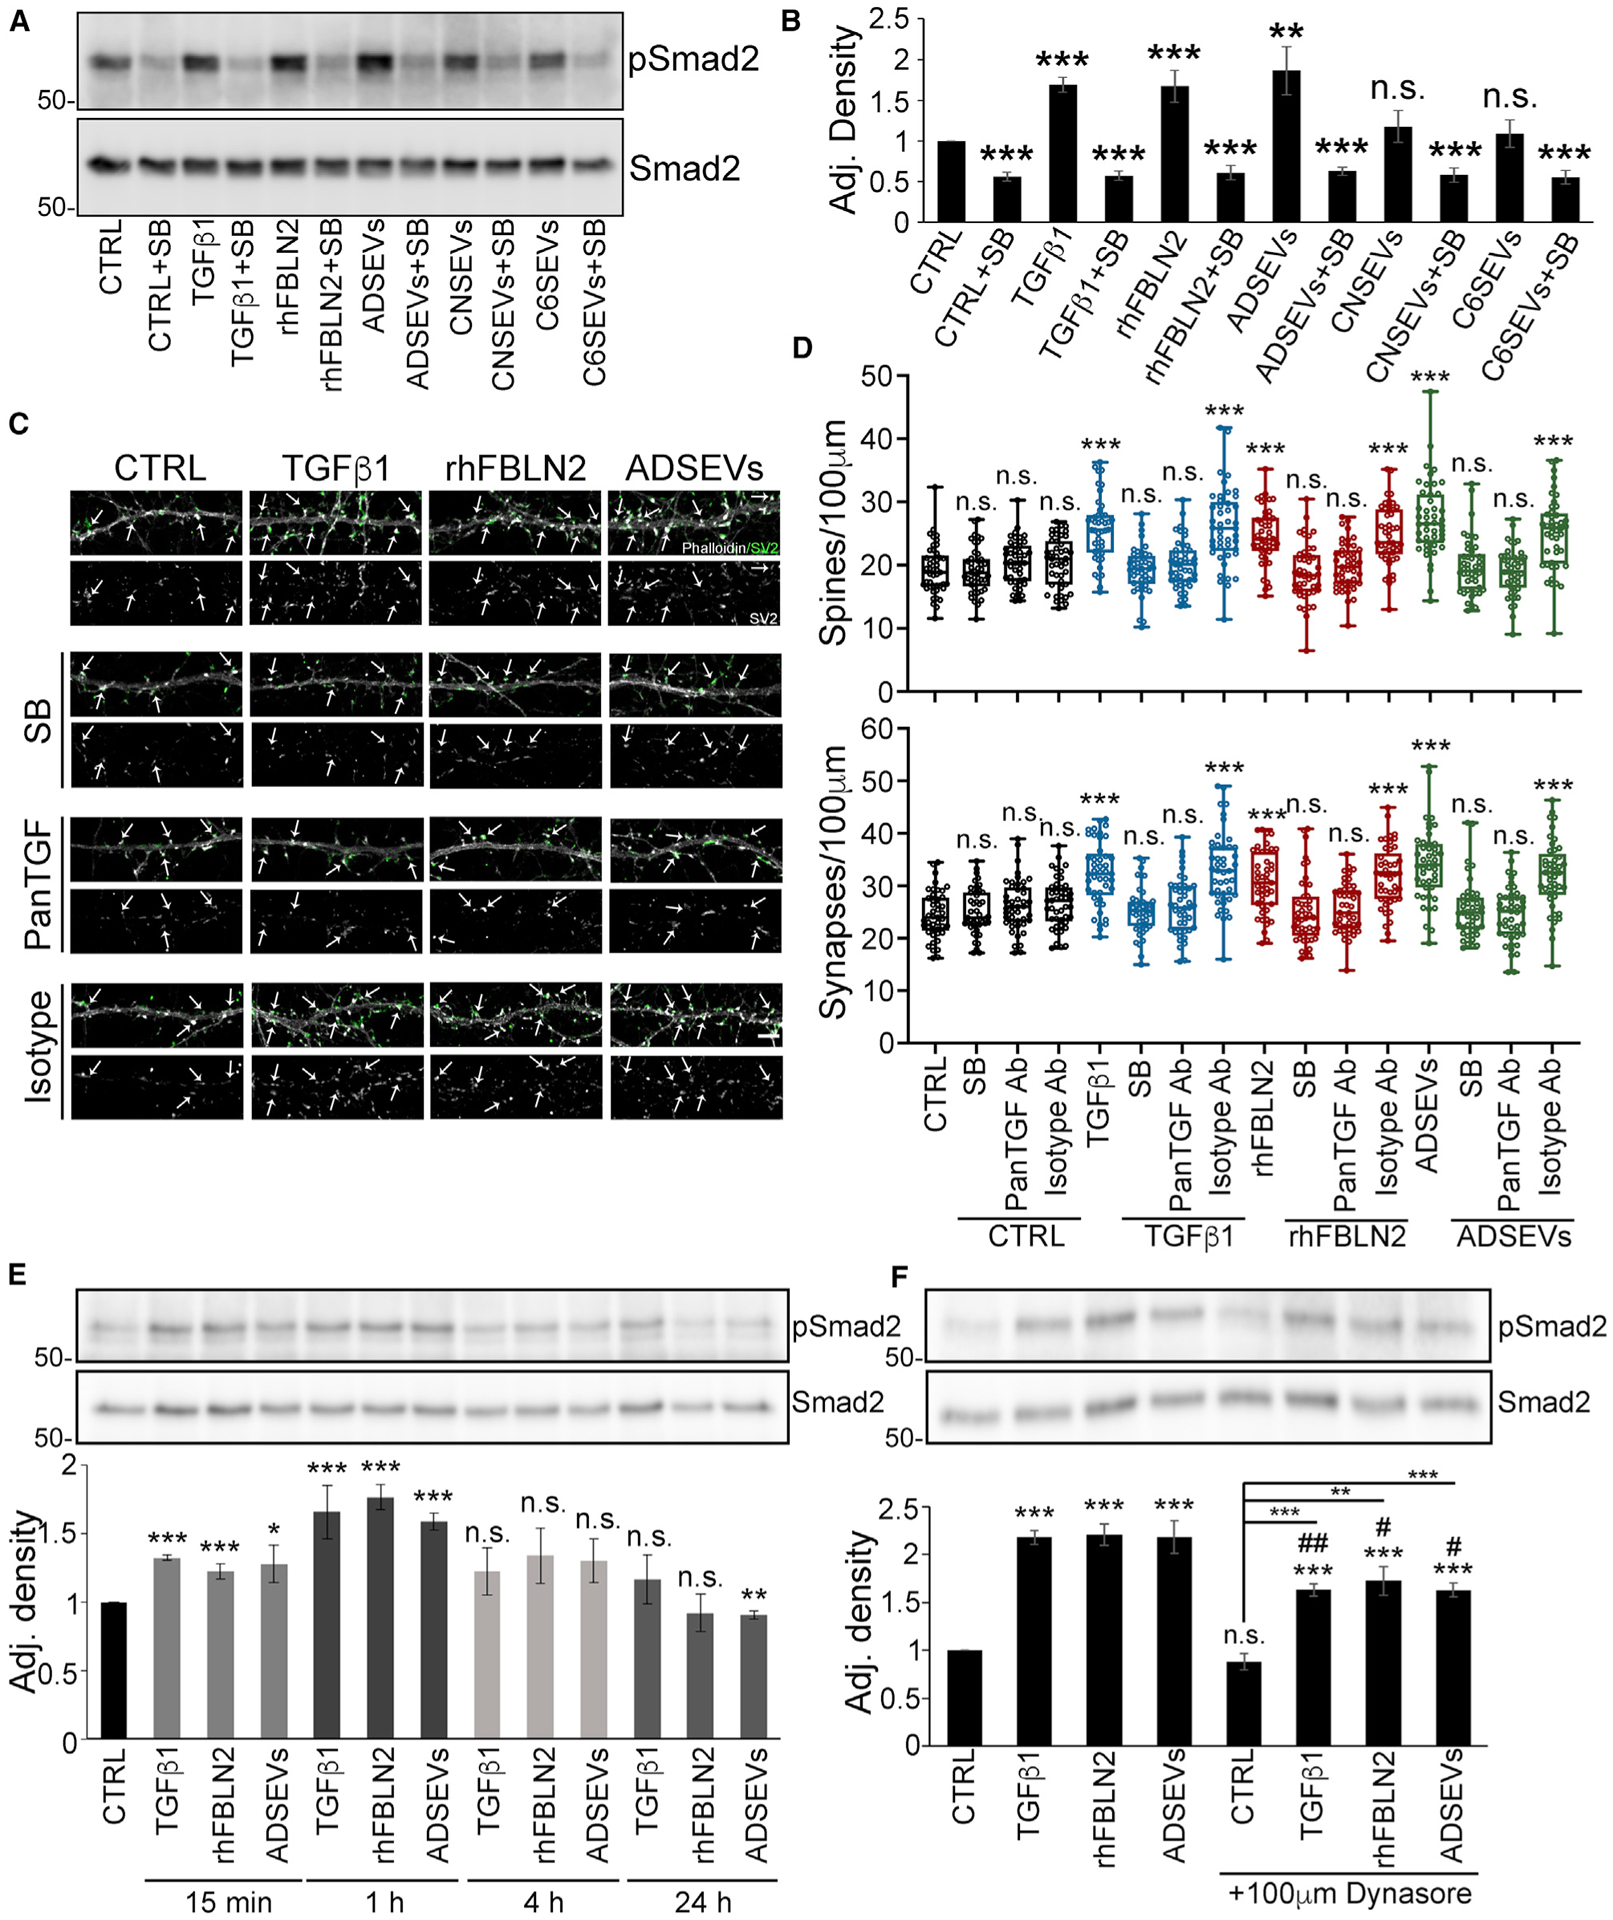
Figure 4. Astrocyte-derived SEVs and fibulin-2 activate TGF-β signaling to increase spine and synapse formation.

(A and B) Cortical neurons were treated with 10 ng/mL TGF-β1, 2 μg/mL rhFBLN2, or 2,000 SEVs/cell, as indicated, for 1 h in the absence or presence of 10 μM SB431542 (SB) before lysis and western blot analysis for phospho-Smad2 and total Smad2. (A) Representative western blots. (B) Quantification of absolute density of pSmad2 levels compared to total Smad2 levels. n = 3. Data represented as mean ± SEM.
(C) Representative images of day 12 neurons treated with 10 ng/mL TGF-β1, 2 μg/mL rhFBLN2, or ADSEVs in the absence or presence of 2.5 μM SB, 10 μg/mL pan-TGFβ-neutralizing antibody or mouse IgG1 isotype control antibody. Images are adjusted for brightness and contrast and cropped to same size using Fiji for better visualization of SV2 colocalization on dendritic spines. SV2 only in grayscale. Overlay of phalloidin in grayscale and SV2 in green. Example dendritic spines are indicated with arrows. Scale bar, 5 μm.
(D) Quantification of spines and synapses from images. n = 45 primary or secondary dendrites from 3 independent experiments. Data represented as box and whiskers plots with all data points shown, bar indicating the median, and the box showing interquartile range.
(E) Representative western blot images and quantification of pSmad2 levels compared to total Smad2 levels for cortical neurons treated with 10 ng/ml TGF-β1, 2 μg/ml recombinant human fibulin-2 or 2000 ADSEVs/cell for 15 min, 1 h, 4 h, and 24 h (n = 3). Data represented as mean ± SEM.
(F) Representative western blot images and quantification of pSmad2 levels compared to total Smad2 levels for cortical neurons treated with 10 ng/mLTGF-β1, 2 μg/mL recombinant human fibulin-2, or 2,000 ADSEVs/cell in the absence or presence of 100 μM Dynasore (n = 4). Data represented as mean ± SEM # indicates comparison between same condition in the absence or presence of Dynasore. #/*p < 0.05, ##/**p < 0.01, ***p < 0.001; n.s., not significant.
