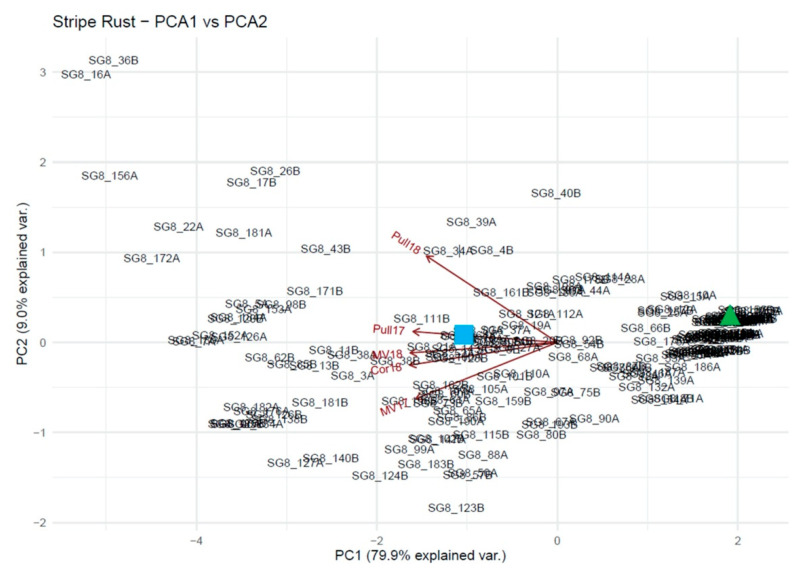
Figure 4.
Principal component analysis representing the genetic diversity of the RIL population used in this study. Each principal component (PC) explains the corresponding contribution of each treatment to the PCs. PC1 explains 79.9% of the variation and PC2 explains 9.0% of the variation. The blue square represents Goetze, the moderately susceptible parent, located at approximately −1, 0 (PC1, PC2). The green triangle represents Skiles, the resistant parent, located at approximately 2, 0.25. The treatment vectors listed from top to bottom are Pullman 2018 (Pull18), Pullman 2017 (Pull17), Mount Vernon 2018 (MV18), Corvallis 2018 (Cor18), and Mount Vernon 2017 (MV17). In general, the individuals with high resistance in all treatments are located in the clusters to the right of the center. The most susceptible individuals are located in the top left corner, with various levels of susceptibility and resistance in between.

